This section includes the following topics:
- About Precise for Sybase tabs
- How most tabs are structured
- About drilling down in context
- About configuring your settings
- Tasks common to most tabs
- About role management in Precise for Sybase
- How information is collected
- Launching Precise for Sybase from the Precise StartPoint
About Precise for Sybase tabs
Precise for Sybase continuously collects high-quality metrics from each supporting tier of your Sybase-based custom applications infrastructure and correlates these metrics to build a clear picture of application performance from the end-user's perspective - that is, response time.
This information is displayed in the Precise for Sybase tabs and provides you with the information necessary to successfully track your database's performance and identify patterns in resource consumption.
The table below describes which tasks can be performed in each tab.
Table 1 Precise for Sybase tabs
| Tab | Description |
|---|---|
| Dashboard | Allows you to quickly identify which Sybase instance has a performance problem, providing the first glimpse into where the problem lies. |
| Current | Allows you to solve the performance problems that are happening now. |
| Activity | Allows you to examine the application's performance over time and helps locate performance bottlenecks in its behavior. |
| Objects | Allows you to identify which Sybase tables are used inefficiently by the application, and their effect on the application components. |
| Statistics | Allows you to identify performance bottlenecks in the way Sybase instance resources are used. |
| SQL | Allows you to tune problematic SQL statements. |
How most tabs are structured
Though each tab is structured differently, most tabs consist of two different areas. Each area can include different control elements, such as tabs and view controls, and displays information in various formats, such as tables, graphs, or charts. The various areas are related to each other in that performing an action in one area affects the information displayed in other areas on the page. For example, the Current tab contains an upper and a lower area. The lower area (Association area) shows information in a table format. Each row in the table represents an instance or entity. The upper area (Main area) displays general information on the selected instance or entity, in context.
The entities displayed in the Association area are associated with the selected entity displayed in the Main area. At times, the relationship between the entity displayed in the Main area and those displayed in the Association area is that of parent to child (such as in the case of Instance to Database), and sometimes it merely represents that there is a relationship between the selected entity and the entities displayed in the Association area (such as when Statement is the selected entity displayed in the Main area and the list of Batches associated with the selected statement is displayed in the Association area).
It is possible to click on a row and drill down to an additional level below the selected level or use the filter feature to determine which information is displayed in the table. When you perform an action on an element in the lower area (in this case the Association area) the information displayed in the upper area (in this case the Main area) changes to reflect the action you requested.
You can control the tab by doing any of the following:
- Keeping the selected entity but changing the associated entities - by selecting a different entity from the Association controls in the Association area.
- Changing the selected entity - by selecting a row in the Association area.
- Changing the view for the selected entity - by selecting a different view in the Main area.
For example, when you want to view information on a specific session in the Current tab, choose Sessions from the Association controls. The Association area changes to display session-related information. The Tab heading and the Main area remain unchanged.
If you want to view detailed information on a specific session, click on the session in the Association area. The Tab heading indicates the newly selected entity; the Main area displays In Sybase information on the session you drilled down to, and the Association area shows information on statements executed by the session you selected.
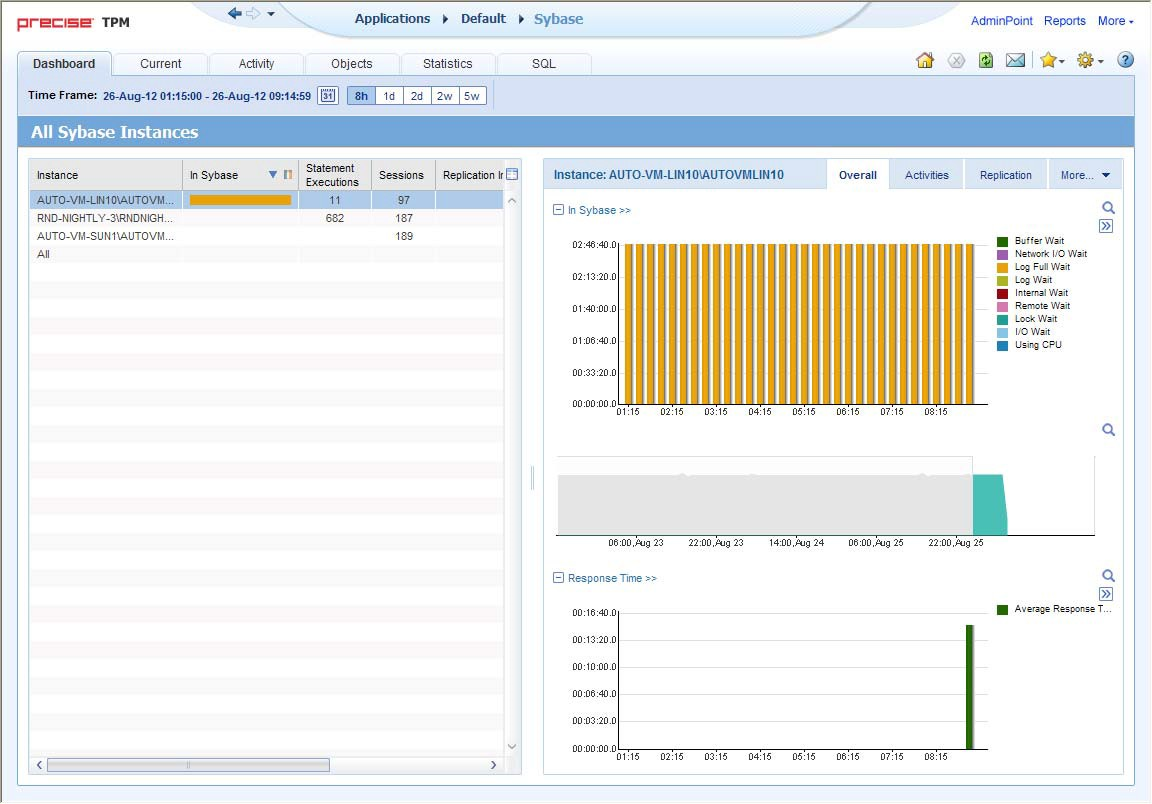
The following figure provides a description of the common key elements in the Current tab and what happens when you drill down to a specific entity.
Figure 1 How a typical tab is structured
About the Precise bar
The Precise bar enables you to keep track of where you have been and provides various controls. The table below describes the function of each of the toolbar buttons.
Table 2 Precise bar functions
| Icon | Name | Description |
|---|---|---|
 | Back | During a work session, keeps track of where you have navigated to. The Back and History buttons enable you to navigate between previously visited views. The Back control displays your previous view. |
 | Forward | Enables you to navigate to the next view. This button is only enabled if you clicked Back or if you chose a history option. |
 | AdminPoint | Launches Precise AdminPoint. |
 | Home | Navigates to the highest level entity, usually the instance or Tier (all instances). The time frame settings remain the same. |
 | Stop | Stops a request for information from the server. |
 | Refresh | Updates the data currently displayed. |
 | Favorites | Enables you to add or remove favorites in your Favorites list. |
 | Send | Opens a new email message in your email program with the link to the current application in context. |
 | Settings | Opens the General Settings, Transactions & Users Settings, and Time Frame Settings dialog boxes. |
| Help | Help | Opens the online help in context. |
About the Main area
The Main area displays general information on the selected entity. The structure of this area depends on the selected entity and tab.
Information can be displayed as follows:
- As two over-time graphs that are displayed side-by-side and describe two data series.
- As a pie chart and a table that are displayed side-by-side. The table displays more details regarding a specific slice in the pie chart.
- As Lock trees and a corresponding Lock Breakdown table.
The View Control drop-down menu allows you to choose different view options. You can access this menu by clicking the arrow icon.
In some tabs, you can filter the contents of the view by clicking the Filter button. See Filtering data.
About the Association area
The Association area lists entities that have similar attributes and that are related to the selected entity named in the Tab heading. Besides the Tab bar, the Association area is the main navigation tool. It enables you to drill down from one entity to related entities (usually of a different type).
The entities displayed in this area depend on the selected tab and the selected entity. The same entity may be displayed in several tabs, with different data displayed for each one (for example, a Sybase table will be displayed in the Objects tab with data from the Sybase data dictionary, and in the Activity tab with data sampled by the Collector agent).
The Association control, accessed by the arrow icon, allows you to associate with different entities. The last option, More..., opens a dialog box that lets you carry out additional operations, such as to view additional associations, change the sort order, or control the number of returned rows.
The information displayed in the Association area is arranged in a tabular format. Each row in the table represents an entity, and each column describes an attribute of the entity, such as text or a graph. It is possible to change the sort order of the entities in the table by clicking a column title.
The Association tabs located above the table let you display different sets of attributes for the entities displayed in the table. The Association tabs are entity-dependent. For some entities, no tabs are displayed.
A numeric column can optionally display a graph, and at times, it can display a stacked bar graph as well. Switching to a graph view in these columns offers some level of breakdown to the information displayed in the column.
The following icons are used to indicate which format information is displayed.
 Displays the information in numerical format.
 Displays the information in a bar graph.
 Displays the information as a stacked bar graph.
 Displays the information in percentage format.
The Association area enables you to drill down to another entity by clicking a row. The information displayed in both the Main area and the Association area will change to reflect your selection. See Filtering data and Associating entities with data that meet specific criteria.
About drilling down in context
The term 'in-context' means that you can display additional information on a selected item by drilling down to another tab or view. The filter settings you defined (for example, the selected time frame you chose) and the entity you selected are carried over to the other view or tab, to allow you to continue analyzing your subject from a different perspective. This concept takes on slightly different meanings depending upon where you are attempting to drill down in context from.
For example, when viewing information on an instance in the Dashboard tab, you can click a link in the Instance Details area (right pane) to view additional information on the related tab, in context to your original selection. Alternatively, when viewing a list of alerts for your product in Alerts, you can launch your product in context and continue investigating the factors that led the system to issue that alert.
In short, the information displayed when drilling down in context is always related to your original selection's settings.
How a drilldown affects the Tab heading
The Tab heading displays the name of the currently selected entity on this screen. Whey you drill down to a new entity in the Association area, the Tab heading changes to reflect the name of the newly selected entity.
About configuring your settings
The following settings allow you to control the appearance and behavior of the user interface. They can be configured from the Settings menu on the Precise bar:
- General settings - Includes the General, Display, and Tree view tabs.
- Time Frame settings
About configuring general settings
On the General tab of the General Settings dialog box, you can adjust the following:
- Number of items that will be displayed for each association. From the list, select the maximum number of items that will be displayed in a table. The default is 50 items. You can control the number of items returned for a specific association by using the More... option in the Association controls. This way, you can display up to 500 items.
- Maximum number of characters to display in a text ToolTip. When you move your cursor over text columns in a table listing Statements or PL/SQLs, a ToolTip appears, displaying more text than can normally fit into a table cell. This field controls the maximum number of characters that can be displayed. The default is 500 characters.
- How often the information in the Current tab is refreshed. If you select the Auto-refresh Current tab every check box, the Current tab automatically refreshes at the specified interval. By default, the tab is not refreshed automatically. If you select this option, the default refresh interval is every five minutes.
About configuring tuner settings
In the Tuner tab you can change the Login name and Password used when launching Sybase SQL Advantage.
About configuring display settings
When you drill down to or choose a different entity, selecting the option on the Display tab of the General Settings dialog box allows you to maintain the selected view or tab when changing from one tab to another. This is sometimes referred to as sticky tabs.
About configuring Tree view settings
(Only applied to Precise products that include a Tree view)
On the Tree View tab of the General Settings dialog box, you can adjust the following:
- Number of categories to display when expanding an item.
- Number of items to display when expanding a category.
About configuring Time Frame settings
You can determine the resolution of the data that is displayed in the overtime graphs using the Time Frame Settings dialog box. By using this dialog box you can define the default time frame to display.
Tasks common to most tabs
The following tasks are commonly performed in most tabs:
- Switching to a different tab
- Selecting a time frame
- Selecting an entity
- Filtering data
- Associating entities with data that meet specific criteria
- Saving a statement
- Focusing on information in overtime graphs
- Sending an email message
- Adding, viewing, and deleting Favorites
- Determining which table columns to display
- Copying data to the clipboard
- Exporting to the Precise Custom Portal
Switching to a different tab
You can easily switch between the different tabs using the Tab Selection bar. When you start your Precise product, the Dashboard tab opens by default. For other Precise products, another tab will open by default. The button of the selected tab is displayed in orange.
To select a tab, click a button on the Tab Selection bar to display information on the selected entity in a different tab.
Selecting a time frame
You can configure Precise for Sybase to display transaction performance data for a specific time frame using the predefined time frame options or calendar icons.
Selecting a predefined time frame from the toolbar displays transaction performance data for the selected time period up to the current time. See Selecting a predefined time frame from the Precise for Sybase toolbar.
Selecting the time frame using the calendar icon, you can choose to define a time range independent of the current time, or to define a time range up to the current time. See Selecting a time frame using the calendar icon. The predefined time frame options are:
- Last 8 hours (8h) (default)
- Last 1 day (1d)
- Last 2 days (2d)
- Last 2weeks (2w)
- Last 5 weeks (5w)
The time frame selected affects all information displayed in Precise for Sybase. Only data that falls within the selected time frame is shown in these areas.
Selecting a predefined time frame from the Precise for Sybase toolbar
To select a predefined time frame, from the Precise for Sybase toolbar, select one of the predefined time frames.
Selecting a time frame using the calendar icon
To select a time frame
- Click the calendar icon. In the dialog box that is displayed perform one of the following:
- To define a time frame independent from the current time, select the ‘Time Range’ option and select the Start and End dates and times.
- To define a time frame up to the current time, select the ‘Last’ option and enter the desired time frame.
- To use one of the three previously used time frames, select the ‘Recently used’ option and from the drop- down menu select the desired time frame.
- To use a previously saved time frame, select Use a previously saved time frame and from the drop-down menu select the desired time frame.
- To save your settings for future access, select Save these definitions for future use as: and enter a name in the corresponding field.
- Click OK.
Selecting an entity
You can select the entity that you want to examine in more detail. To select an entity, on the Main area of the tab, select the entity you want to examine.
Filtering data
You can focus on specific contents of the Dashboard and Activity tabs by showing a subset of the information. This shows the contribution of entities such as programs and users.
You can define flexible selection criteria in the Filter dialog box. To open the dialog box, you need to click the Filter Off icon next to the Time Frame selector. Filter On or Filter Off indicates the current state of the filtering mechanism. Filter Off means all information is shown; Filter On means a subset of information is shown.
When you apply your selections in the Filter dialog box, the information displayed in both the Main area and the Association area is modified to reflect your selections. Also, the filtering continues to apply when you drill down to associated entities.
You can enter multiple criteria, in which case each criterion is applied using the logical AND operator.
To filter data
- Click Filter is Off/Filter is On.
- In the Filter dialog box, do the following for each entity you want to filter:
- From the left drop-down list, select an entity.
- From the middle drop-down list, select an operator, such as Like, < >, Not Like, In, Not In.
- In the text box, type the criteria (case sensitive) for the selected entity.
If you select the operator Like or Not Like, you can use the % wildcard character. If you select the operator In or Not In, type a comma to separate values.
- Click OK.
Associating entities with data that meet specific criteria
You can associate the displayed entity with specific data to focus your analysis.
The criteria no longer apply when you drill down to another entity.
To associate entities with data that meets specific criteria
- Click the arrow located on the left of the Association controls and select More....
- In the Associate With dialog box, on the Entries tab, select the entity you want to associate data with from the Populate table with list.
- In the Sort entries by list, determine according to which criteria you want the information to be sorted and in which order.
- On the Display top list, select the number of rows to display.
- On the Criteria tab, do the following for each entity you want to associate data with:
- From the left drop-down list Select an entity.
- From the middle drop-down list Select an operator, such as Like, < >, Not Like, In, Not In.
- In the text box Type the criteria (case sensitive) for the selected entity.
If you select the operator Like or Not Like, you can use the % wildcard character. If you select the operator In or Not In, type a comma to separate values.
- Click OK.
Saving a statement
Save As allows you to save the statement or batch so that you can examine its access plan at a later date.
To save a statement for future use
- Select the statement you want to save in the Association area. You can click the Save As button only after you drill down to the statement and it moves up to the Main area.
- On the Precise bar, click the Actions tab and click Save As.
- In the Save Statement dialog box, enter the following properties:
- Instance. The name of the instance that the statement belongs to.
- Cabinet. The name of the cabinet that the statement is saved in (creates a cabinet if it does not already exist).
- Folder. The name of the folder that the statement is saved in (creates a folder if it does not already exist).
- Name. The name of the statement (generated randomly).
- Database. The name of the database where the statement is running.
- User. The statement’s parsing user.
- Enter the Sybase text for the statement in the Text frame.
- Click OK.
The new statement is saved in the PMDB in a logical cabinet and folder hierarchy.
Focusing on information in overtime graphs
Some entities display an overtime graph. The overtime graph displays entity statistics over a specified time period. Depending on the number of points displayed in the graph, you may need to zoom in or out. The text displayed on the x-axis varies according to the time frame. If there is a year or day change, x-axis labels will display accordingly.
To focus on information in overtime graphs, select the desired time frame on the overtime graph, click and drag the left or right handle to increase or decrease the time range. The small zoom (spyglass) icon will display on the upper right of the selected time range, and above the overtime graph legend. Click the zoom icon to zoom in according to the selected time frame.
Sending an email message
You can send an email message to one or more recipients from the Precise toolbar. The default subject for the message will be “Link to a Precise application”.
The email will include a link to the Precise product in the current context (time frame and selected entries).
To send an email message
- Click the email icon on the Precise toolbar. The default email program opens.
- Fill in the required fields and click Send.
Adding, viewing, and deleting Favorites
The Favorites feature allows you to save a specific location in your application and to retrieve the same location later without having to navigate to it.
About the Favorites feature
The new Favorites feature includes the following options:
- Relative Time Frame. Saving relative time frame instead of static date. For example, saving the last 7 days will always display the last 7 days, depending on the day entered.
- One click to specific location. Once you open Precise by launching a saved Favorite item, you will not have to enter a login credential nor click the login button.
- IE Favorites support. Adding a new Favorite item in Precise will also add it to the IE Favorites menu.
- Auto Complete. The Favorites dialog includes a new combo box which supports AutoComplete.
- Auto Naming. The Favorites dialog generates item names based on the current location.
UI description
A Favorites menu has been added to the Precise bar in each product including StartPoint.
An Add/Delete Favorites option under the Favorites menu allows you to save the current location or delete an existing one.
To add a new Favorite location
- On the Add/Delete Favorites dialog box, enter the name of the new Favorites entry.
- Click Add. The dialog box is closed and the new Favorite is added to the list.
To view a Favorites location
- On the Precise bar, click Favorites.
- Select the Favorites location you want to view.
To delete an existing Favorite location
- On the Add/Delete Favorites dialog box, select the Favorite location to be deleted.
- Click Delete. The dialog box closes and the selected Favorite is deleted from the list.
The favorite address is displayed in the Address field and cannot be edited.
Determining which table columns to display
Tables are used to display information about the set of related entities in the Main and Association areas. It is possible to determine which columns to display in the Association area tables.
To determine which columns to display in the Association area
- Click the Table icon on the upper right-hand side of a table and select Column Chooser.
- In the Table columns dialog box, click the arrows to move the names of the columns that you want to display to the Visible box and the ones that you do not want to display to the Invisible box.
- Click OK.
Copying data to the clipboard
At times you may want to save data displayed in the table area in a Microsoft Excel spreadsheet for further analysis or save an image of a graph to the clipboard.
To copy data displayed in the Association area to the clipboard, click the Table icon on the upper right-hand side of a table and select Copy to clipboard. The table can be pasted into Microsoft Excel or as an HTML file.
To copy a graph to the clipboard, right-click a graph and choose Copy to clipboard.
You can now paste the image into any application that works with the clipboard.
Exporting to the Precise Custom Portal
The Export to the Precise Custom Portal Portlet feature enables you to export the view of the chosen table or graph and generate a portlet with that view in the Precise Custom Portal, so that it will provide you with another way of monitoring your application.
Prerequisites
To be able to use this feature, you need to have the following rights in Precise, view permissions to all Tiers in the application. If you do not have sufficient rights, you will get an error message when trying to execute this feature.
Exporting the information
You can either export a table view or a graph view.
The name field has the following restrictions: maximum 100 characters.
To export a table view
- Click the Column Chooser icon.
- Select Export to the Precise Custom Portal Portlet.
- Insert a name in the name field that clearly describes the table view.
- Click OK.
To export a graph view
- Right-click the graph.
- Select Export to the Precise Custom Portal Portlet.
- Insert a name in the name field that clearly describes the graph view.
- Click OK.
About role management in Precise for Sybase
The Roles management feature in Precise for Sybase lets you assign roles to users and control whether they will be able to do the following operations:
- Gen_Estimated_Plan (explain). Lets you generate a new execution plan.
- Launch_Sybase_Tool. Lets you launch external Sybase tools.
It is possible to grant permissions to all roles or to revoke permission from individual roles. Permission is a combination of permission type (such as: INSTALL, ADMIN, MONITOR) and operation (such as: VIEW, UPDATE).
Certain types of permission enforce permission dependencies. For example, if you grant a TUNE.RECOMMEND permission it will automatically grant TUNE.EXPLAIN. In the same manner, if you revoke TUNE.EXPLAIN then the TUNE.RECOMMEND permission is also revoked. You can configure permissions and roles in AdminPoint.
For more information on configuring permissions and roles, see the Precise Administration Guide.
How information is collected
Precise for Sybase collects and displays performance data that enables quick and accurate performance monitoring and analysis. To understand the information displayed in the various graphs, tables and views, it is important to understand how information is collected.
About duration values
Precise for Sybase displays duration values for several entities.
The table below describes the duration value for each type of entity.
Table 3 Duration values for entities
| Entity | Description |
|---|---|
| Current Session | The time that has elapsed since the session started (login time). This is not the time the session was active executing statements. For example, if a session was connected to Sybase for one hour without executing any statement, the duration will still be one hour. |
| Programs (Logins, Machines, DB Users, Databases, Time Units, and so on.) | The elapsed time of the sessions executing the program. The time is not measured from the login time (as it is in the Current session entity), but from the moment the Collector agent started. The average duration counter displays the average time each program has been running. |
| Statement (batch) | The time that elapsed while the statement was executed. This is very similar to the duration of programs (see above); but since the statement is almost always active, this duration also indicates the time the statement was active. The average duration counter displays the average execution time of the statement. |
About session states
Sybase provides reporting on many different types of events. Precise for Sybase groups events according to logical relationships to enable you to easily pinpoint heavy resource consumers.
For example, when the Collector agent samples the Sybase, it assigns a state for each connection. An application may wait for many events in Sybase. To simplify analysis, and help you to easily identify the source of resource consumption, Precise for Sybase groups various wait types into wait groups or states and defines the status of sessions currently connected to Sybase by their states. The state is divided into two types of states: In Sybase and Non-In Sybase. The session states are described in the following table.
Understanding In Sybase session states
The In Sybase session states signify that the session is performing activities in Sybase. The table below describes the In Sybase session states.
Table 4 In Sybase session states
| Icon | In Sybase State | Description |
|---|---|---|
 | Using CPU | The session is currently executing and is not waiting for any other event. For versions lower than version 12.5.0.3, the Using CPU state is usually identified by sysprocesses status = Runnable/Running. For version 12.5.0.3 and higher, this state is identified by the monProcess WaitEventID field containing a value in Wait Class 1 (waiting to be scheduled). Usually this state is an ideal state, but verify that the amount of CPU usage is reasonable compared to the transaction being performed. In addition monitor this state over time and verify that a growth in the CPU usage is a result of a growth in load and not a result of any change that caused the performance to degrade. |
 | I/O Wait | This state indicates the session is waiting for an I/O operation to terminate. For versions lower than version 12.5.0.3, this state is usually identified by sysprocesses status = sleeping, unless the cmd field = COMMIT/ROLLBACK/LOG SUSPEND. For version 12.5.0.3 and higher, this state is identified by the monProcess WaitEventID field containing a value in Wait Classes 2 or 3 (waiting for a disk read / write to complete). |
 | Lock Wait | The session is waiting for a lock to be released. The lock is held by another session. For versions lower than version 12.5.0.3, this state is identified by |
 | Log Full Wait | The session is waiting for an operation of the log file to terminate. This state is generally encountered during a transaction log full. For versions lower than version 12.5.0.3, this state is identified by |
 | Log Wait | The session is waiting for an operation of the log file to terminate. This state is generally encountered during a commit or rollback operation. For versions lower than version 12.5.0.3, this state is identified by |
 | Buffer Wait | The session is waiting to access a user log cache. For versions lower than version 12.5.0.3, this state is identified by |
 | Latch Wait | The session is waiting for an internal lock to be released. Latches are short term light weight synchronization objects. Latches are not held for the duration of a transaction. Latches are used for datapage and datarow locking, including OAM and allocation pages, but not for allpages locking. They mostly occur in SMP applications. For versions lower than version 12.5.0.3, this state is identified by |
 | Remote Wait | The session is waiting for a remote query to terminate. For all versions, this state is identified by sysprocesses status = remote I/O. |
 | Network I/O Wait | The session is completing a network I/O operation. Network I/O occurs if results from a large result set are transferred to the client using shared memory netlibs or TCP/IP. For versions lower than version 12.5.0.3, this status is identified by a status of |
Understanding Non-In Sybase session states
The table below describes the Non-In Sybase session states.
Table 5 Non-In Sybase session states
| Icon | State | Description |
|---|---|---|
 | Request Wait | The session is waiting for the client to issue a request. For versions lower than version 12.5.0.3, this state is identified by |
 | Other Wait | Sessions waiting in states not described here are assigned the Other wait state. |
 | Waitfor Command | The session is executing the WAITFOR DELAY command. For versions lower than version 12.5.0.3, this state is identified by |
 | Parallel Sync Wait | The session is waiting for a synchronization message from another process in the family. For versions lower than version 12.5.0.3, this state is identified by |
About Statement identifiers
Each statement is identified by the following parameters:
- Text. The actual statement text.
- Database. Each statement is associated with a single database.
- User. Each statement is associated with a single user (also called the parsing user).
For example, the statement "select * from sysobjects" executed in the master and pubs3 databases is represented by two different statements in the product. The ability to roll-up the performance of those statements to one is also important. This is supplied using the collapsed statement entity.
How Precise for Sybase monitors availability
The Precise for Sybase Collector agent monitors Sybase every second and collects data regarding resource consumption. If the instance status (Up/Down) was changed, a message code is sent by the Collector agent and causes the current availability of the instance saved in the PMDB to be changed. In addition, the availability of the instance is saved, over time, in the PMDB. During a planned downtime period the instance availability is showed as it was available during this period.
If the Precise for Sybase Collector agent is down, the instance availability status reported is "Unknown."
Launching Precise for Sybase from the Precise StartPoint
Precise is a Web-based application. You can access the Precise user interface using the Internet Explorer browser, version 6.0, or later.
The syntax of the Precise URL address is: http://<server>:<port>, where <server> refers to the Precise FocalPoint and <port> refers to the port number used by the GUI Web server. By default, the port number is 20790. For example: http://beanotown:20700.
This URL provides secure access to the StartPoint using authorized roles. From here, you can launch all Precise products. It gives you a quick overview of the status of your applications and access to the AdminPoint, where you can perform various management tasks (For more information, see the Precise Administration Guide).
You must have local administrator privileges on the server where the StartPoint is running.
To launch Precise for Sybase using Precise StartPoint
- Type the address of the StartPoint user interface into the Address bar of your browser and click Enter.
The Precise login page opens. The login page provides secure access to Precise and to your specific product. - Specify your authorized role name and password.
By default, both role name and password areadmin. For more information about role names, see the Precise Administration Guide. - Click Login.
The StartPoint page opens. This is the Precise home page. - On the Product Selection bar, from the drop-down list, select the product you want to launch.