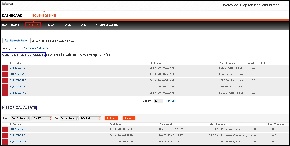
The Alerts view provides comprehensive information on availability and performance issues in your SQL BI environment. The Alerts view displays up to date information on all active and historical alerts. Click the image to view full size.
|
In the Alerts view you can:
- Get an overview of all current alerts
- Get an overview of all historical alerts
- Verify if the SSAS, SSIS, or SSRS services are available
- View OS statistics for monitored SQL BI Service instances
- View SSAS, SSIS, and SSRS performance alerts
- Verify the status of SQL BI Manager
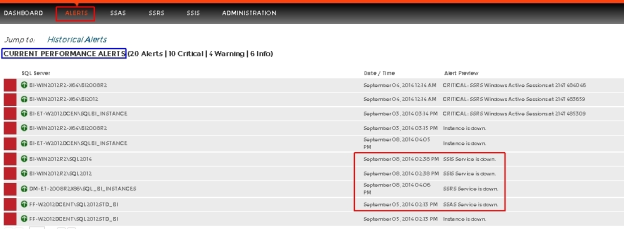
Overview of current alerts
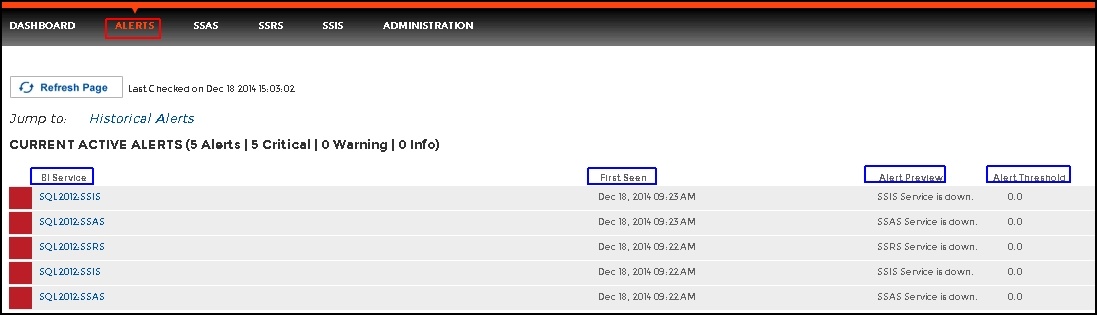
The current performance alerts roll up view displays detailed information such as:
- BI Service
- Date/Time of alert inception
- Alert Preview (description)
- Alert Threshold
The most recent alert always shows up at the top of the panel.
The following colors in the Alerts view are associated with a status and action within SQL BI Manager:
Color | Meaning |
|---|---|
Green | Acceptable threshold where SQL BI Manager does not generate an alert. |
Gray | Informational threshold where SQL BI Manager generates an informational alert. |
Yellow | Warning threshold where SQL BI Manager generates a warning alert. |
Red | Critical threshold where SQL BI Manager generates a critical alert. |
From the current performance alerts you can jump to your historical alerts. Find the Jump to Historical alerts option at the right top corner of the view.
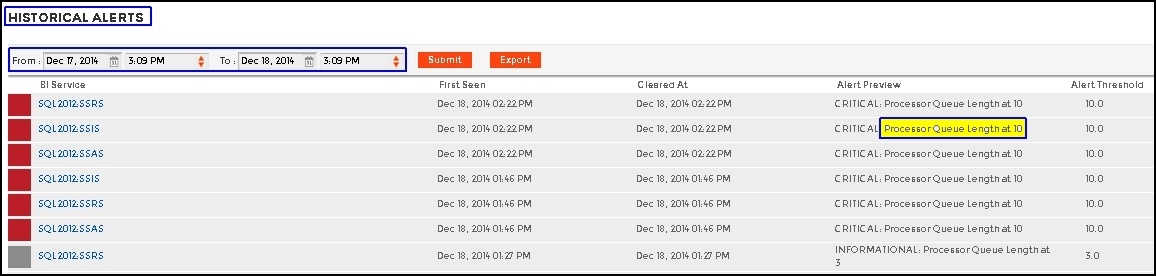
Overview of historical alerts
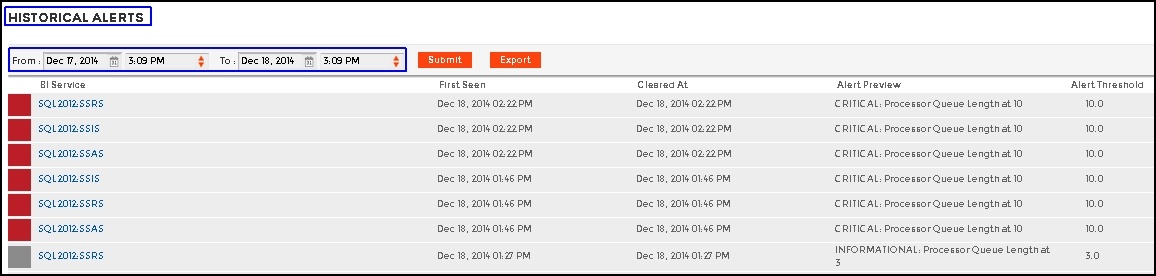
In SQL BI Manager alerts shift from current performance alerts to historical alerts when they fall below their previously established threshold and auto resolve.
In SQL BI Manager you can define alert thresholds, see Configuring alert thresholds.
The historical alerts roll up view displays detailed information such as:
- BI Service
- Date/Time of alert inception
- Alert Preview (description)
- Alert Threshold
In the historical alerts roll up view you can view alerts in a specific time frame.
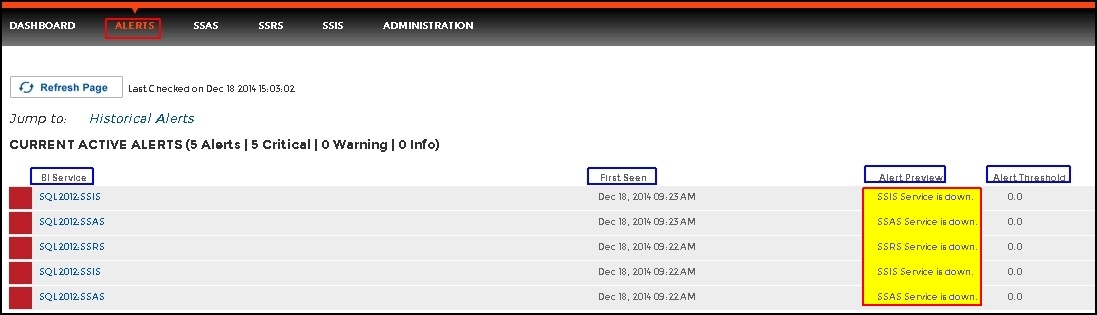
Verifying availability of BI services
In the Alerts view of SQL BI Manager you can easily identify the availability of the following BI services:
- SSAS service
- SSIS service
- SSRS service
Viewing OS statistics for SQL BI Service instances
SQL BI Manager alerts on Operating System statistics for your monitored SQL BI Service instances.
The available Operating System counters, enabled by default, include:
- OS% Processor Time
- OS Paging
- Average Disk Milliseconds/Read
- Average Disk Milliseconds/Write
- Processor Queue Length
For additional information on OS counters, see Metric alerts.
Viewing SSAS, SSIS, and SSRS performance alerts
SQL BI Manager alerts on the performance of the SQL Server Analysis Services, SQL Server Integration Services, and SQL Server Reporting Services.
The available SSAS performance counters, enabled by default, include:
- SSAS CPU Utilization
- SSAS Memory Utilization
The available SSIS performance counters, enabled by default, include:
- SSIS CPU Utilization
- SSIS Working Set
- SSIS Private Bytes
The available SSRS performance counters, enabled by default, include:
- Web Service-Processing Failures
- Web Service- Rejected Threads
For additional information on SSAS, SSIS, and SSRS performance counters, see Metric alerts.
Verifying the status of SQL BI Manager
SQL BI Manager allows you to verify the proper functioning of the application. The system alerts you in the following scenarios:
- SQL Server BI services are unable to be monitored due to errors.
- Application components crash or become unresponsive.
SQL Business Intelligence Manager identifies issues within the SQL BI environment to help optimize BI service performance. Learn more > >