The Alerts Detail screen in the SQLDM Web Console provides you with detailed statistics on your alerts.
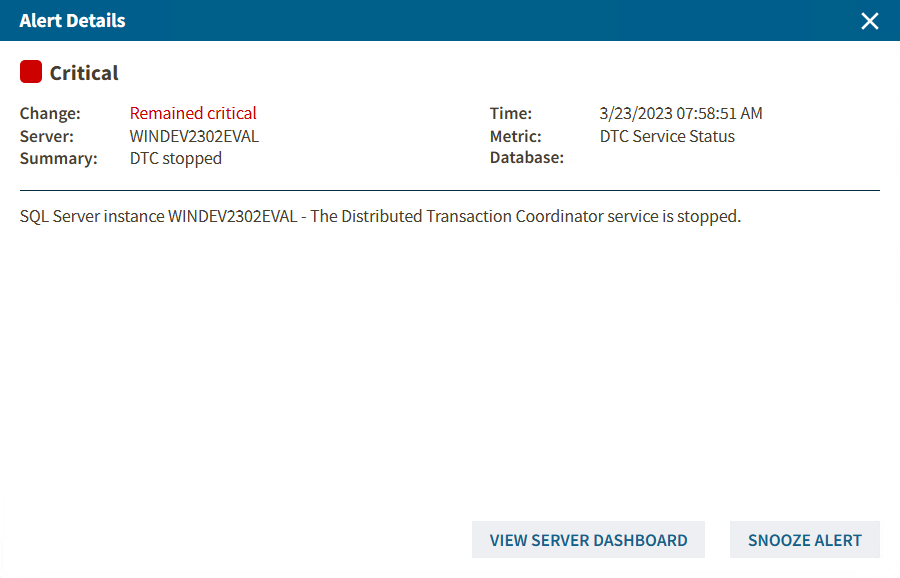
On the Alerts Detail screen you can find the following information:
- Alert Status
- Change
- Server
- Summary
- Time
- Metric
- Database
- Alert Details
Additional button options
View Server Dashboard
You can access the Overview tab of a single instance directly from the Alert Details window by clicking the VIEW SERVER DASHBOARD button to check specific category views such as sessions, queries, query waits, resources, databases, and alerts.
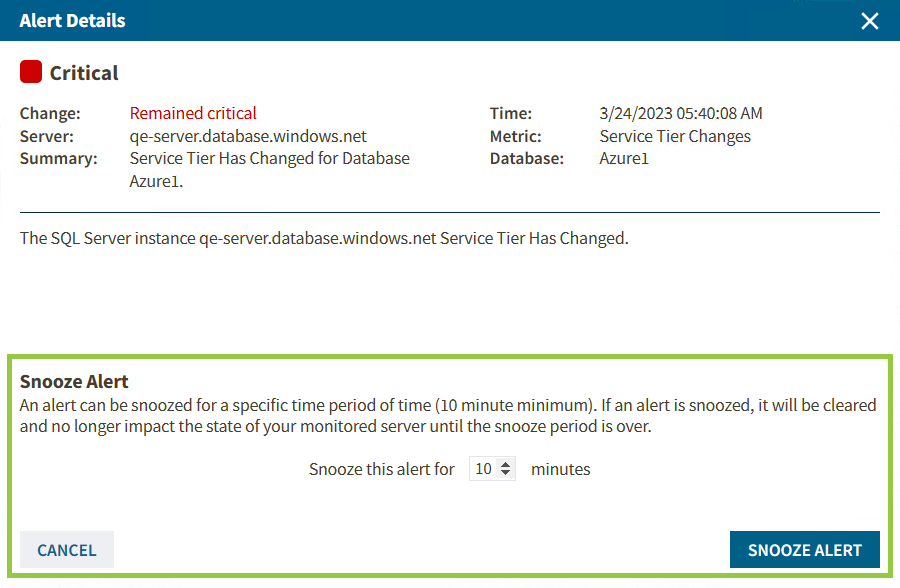
Snooze Alert
You can snooze a specific alert by clicking the SNOOZE ALERT button and configuring the snooze time as shown in the image.
Access the Alerts Detail screen
SQLDM Web Console provides several paths to access the Alerts Detail screen. The first access path is by clicking any row in the alerts roll-up view of the Alerts tab. The second access path is by clicking over an alert row in the Alerts section of the single instance Overview tab.