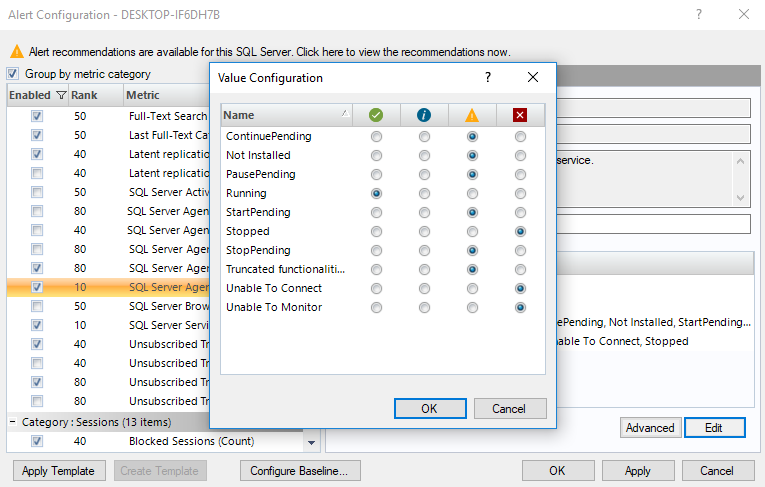
The Value Configuration window allows you to select whether you receive an alert for a particular event based on the selected level for that event. For example, if you select the Critical alert level for Offline for Database Status, you receive a Critical Level alert if the Database is ever offline. The alerts are available as shown in the following image.
Alert Level | Description |
|---|---|
| The selected metric is in an OK state. |
| The selected metric is in an Informational state. |
| The selected metric is in a Warning state. |
| The selected metric is in a Critical state. |
Access the Value Configuration window
SQL Diagnostic Manager displays the Value Configuration window when you attempt to edit values for certain metrics.
To access the Value Configuration window:
- Right-click a monitored SQL Server instance, and then select Configure Alerts.
- In the Alert configuration window, select one of the following metrics:
- Database Status
- Mirroring Status
- OS Metrics Collection Status
- DTC Status
- Full-Text Search Status
- SQL Server Agent Status
- SQL Server Status
- SQL Server Agent Job Completion
- Host Power State
- VM Power State
- Click Edit.
About informational alerts
Informational alerts allow you to set a threshold that, when generated, triggers a status that does not affect the overall status of the server within SQL Diagnostic Manager. You can use informational alerts to notify an administrator of the state of a particular metric for a server or trigger secondary processes that could take action to prevent issue escalation.
Note that for certain metrics, using the informational alert means that you no longer receive a warning or critical alert for events generated by that metric. Please review the situation before setting up an informational alert.