To see how every metric is calculated by SQL DM for MySQL you need to position the mouse over the name of each metric. The name of the monitor, formula used by the calculation displays with an explanation as a 'tool tip popup'. The tool-tip also explains how the result shown is evaluated, and how the value relates to an overall or some specific server performance metric.
Every metric is documented in the SQL DM for MySQL web interface itself.
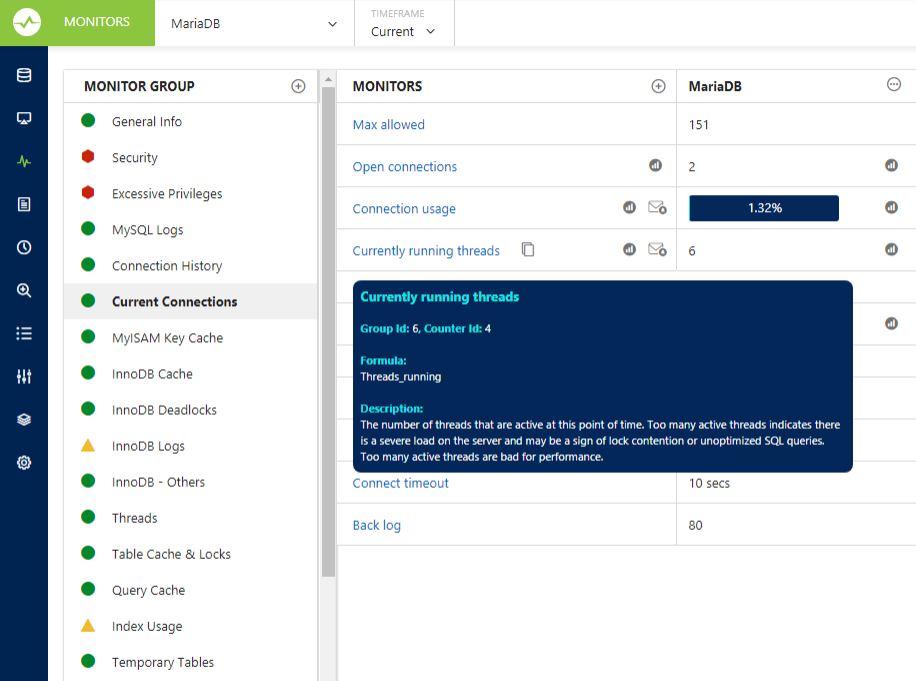
If you require more details on the metric, click the hyperlink to get a detailed view.
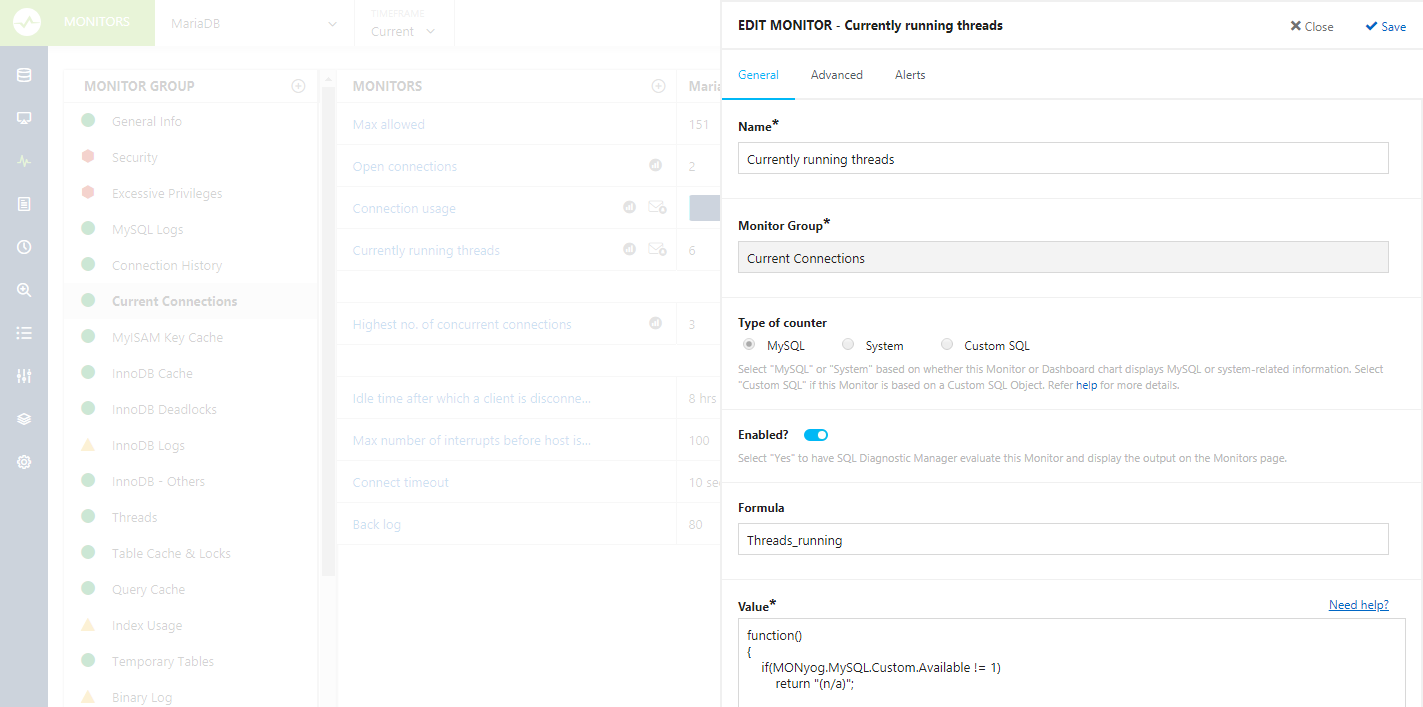
The monitors can be edited or duplicated by clicking the icons adjacent to the name of the monitor. The mail alert icon is displayed adjacent to the name of the monitor specifying an alert condition. The blue coloured mail alert icon indicates that the notification has been enabled with the alert condition specified.