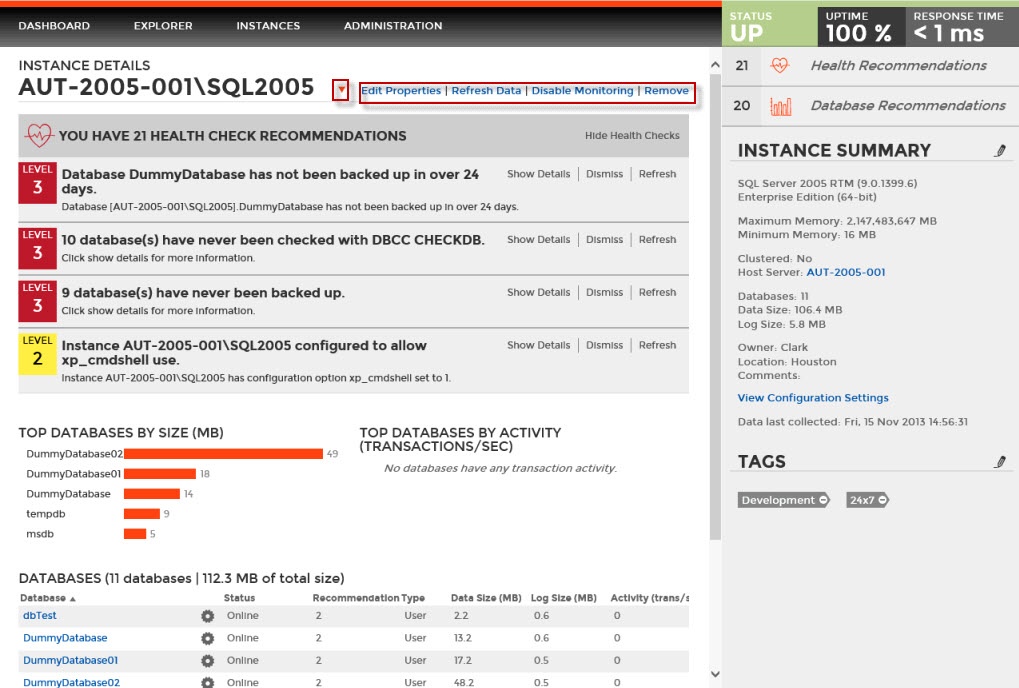
The instance details view allows you to see specific information for an instance. SQL Elements displays a glimpse of this instance health check recommendations, top databases, relevant information, and also get access to the instance host server computer details and configuration settings.
Additionally, on the instance details view, on the top right section, you can find the following options:
- Edit Properties
- Refresh data. This option forces to collect data off schedule so you can have the latest information for this instance.
- Disabling monitoring
- Remove
If you click the drop down arrow next to the instance name, you can choose another instance to access its respective details.
What information can you find on the instance details view?
Health Check Recommendations
This section provides you with specific health check recommendations for the selected instance. SQL Elements groups these health checks by type, and orders them by level of criticality; where Level 3 is critical, Level 2 is warning, and Level 1 is informational.
You can choose to show details, hide details, dismiss, or refresh any health check recommendation. For more information on how to view health checks recommendations for an specific instance, refer to Viewing Health Check Recommendations for a specific instance.
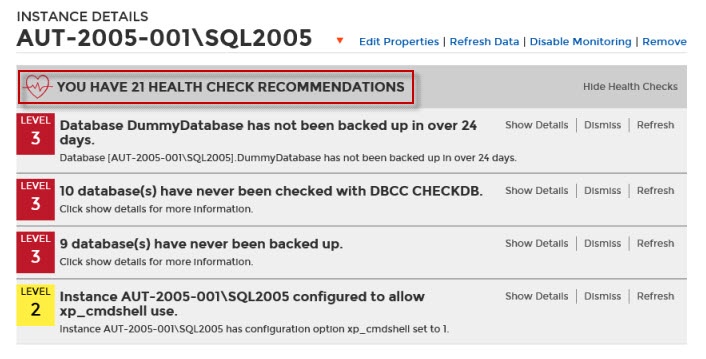
Health Check Recommendations
To view what health checks are performed by SQL Elements, refer to What Health Checks are available in SQL Elements?
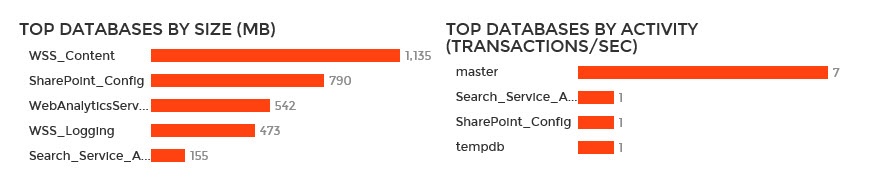
Top bar graphs
These graphs provide insight of the most important databases for your instance, based on databases size and how busy they are (transactions per second).
SQL Elements shows you the following bar graphs:
- Top Databases by size (MB).
- Top Databases by Activity (Transactions per second).
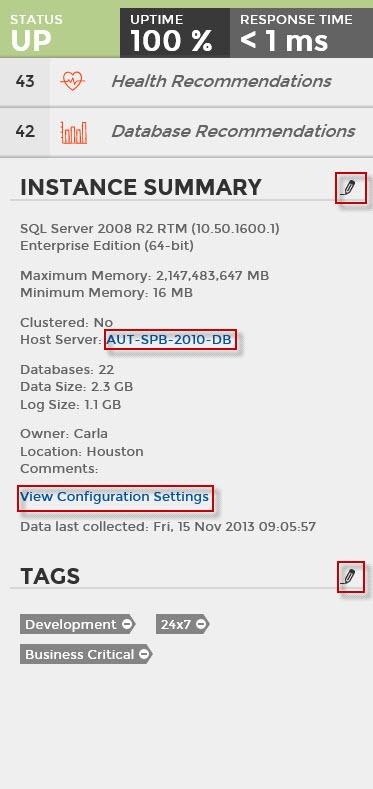
Instance summary and status
On the right side of the instance details view, you can see a section that provides general information for your instance.
On this sidebar you can see:
- The status of the instance (up or down).
- The uptime and response time status.
- The number of health check recommendations for this instance.
- The number of database recommendations for this instance.
- A summary of the instance details, with information about its Microsoft SQL Server version, maximum memory, minimum memory, if it is clustered, host machine, number of databases, data size, log size, owner, location, and comments.
- Computer details. This option is accessible by clicking the name of the host server computer. For more information on what is available on this view, go to Viewing computer details.
- Configuration Settings, for more information go to View configuration settings.
- Date and time the last data was collected for this instance.
- The tags that this instance belongs to. Click the pencil icon to access the Managing tags for an instance window where you can add new tags or choose other tags for this instance.
Edit instance properties
Click the pencil icon next to the Instance Summary title and you can access the options for editing your instance properties such as owner, location, comments, and credentials. For more information, refer to Edit instance properties.
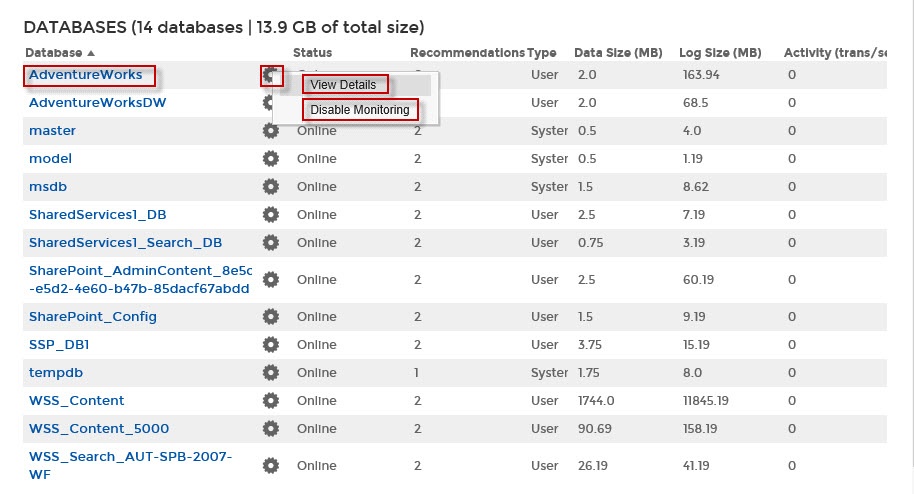
Instance Databases
At the bottom section of the instance details view, SQL Elements displays a list with all databases available on this instance.
This list shows you information about the status, number of recommendations, type, data size, and log size for each database.
There is a gear icon next to the database name, click this icon to get two options:
- View Details
- Disable Monitoring
The View Details option allows you to see the respective database details; you can also access this option by clicking the database name. For more information on what information is available on these details, go to Viewing Database Details.
SQL Elements allows you to disable the monitoring of a database. When you choose this option, you will no longer receive alert notifications from this database until you enable its monitoring again.
Note
When you enable a database, after you have disabled it for a period of time, SQL Elements will display its health check recommendations only after the collection jobs have been run first - either through scheduled jobs or manual refresh.