The SQL Elements dashboard is the home page of the product. The dashboard provides an overview of your environment, a high level status of your registered instances, and health check recommendations for issues found across your environment.
On the dashboard you can find the following sections:
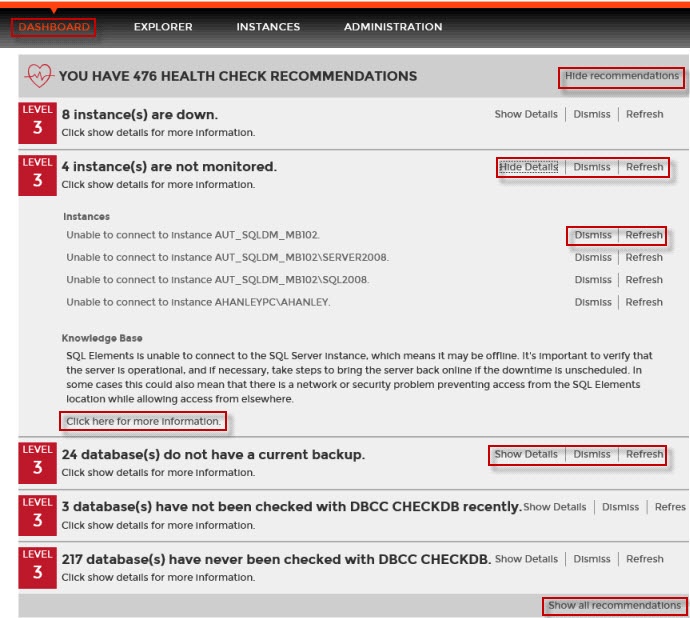
Health Check Recommendations
SQL Elements performs health checks on your registered instances to help you monitor the most important issues across your environment.
For more information about the health checks performed by SQL Elements, refer to What Health Check Recommendations are available with SQL Elements? section.
On this section of the dashboard, SQL Elements shows you the most critical health check recommendations for your environment, grouped by health check type, and ordered by level of criticality, where Level 3 is critical, Level 2 is warning, and Level 1 is informational.
If you have no health check recommendations, you will see the message: All instances are passing their health checks.
You can click Show Details or click the name of the health check recommendation to access to:
- List of instances or databases affected by the respective health check.
- Individually Dismiss the health check recommendation.
- Individually Refresh the status of a database or instance.
- The knowledge base of the Health Check Recommendation.
If you do not want to see these details, click Hide Details.
Health check recommendations can be dismissed for an individual database or instance but you can also choose to Dismiss the whole health check recommendation.
You can also get the most updated information for a specific health check recommendation by clicking Refresh.
Dismissing Health Check Recommendations
Dismissing a health check recommendation causes SQL Elements to ignore this recommendation temporarily. You do not get alerts until the health check passes and then goes into an alert status again.
Click Show all recommendations on the bottom part of this section to get a complete view of all health check recommendations for your environment.
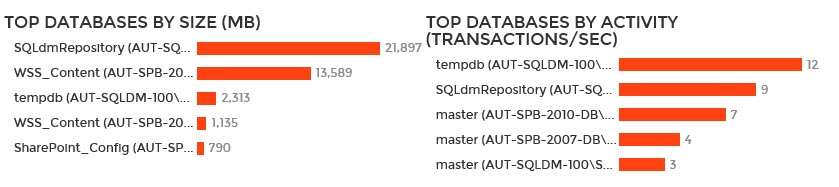
Databases Graphs
SQL Elements provides you bar graphs of the most important databases from your environment. You can get a view of the largest and busiest databases across your instances.
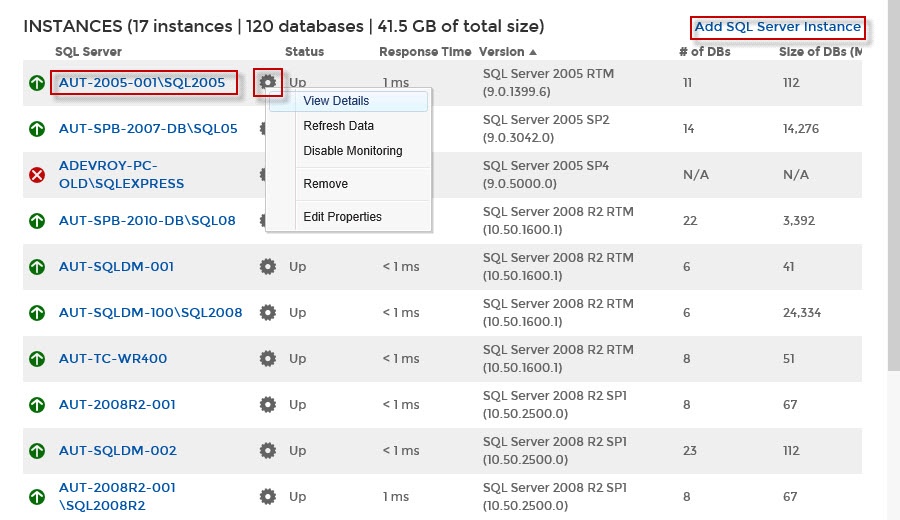
Instances
This section provides you with a table of all the registered instances on your environment. It displays information about the instances status, response time, SQL Server version, number and size of databases per instance. You can click any of the column headers to order the table by the respective field.
On this section, you can also add new instances by clicking the Add SQL Server instance option located on the top right section of this table. For more information on how to add instances, refer to Adding SQL Server instances.
By clicking the gear icon next to an instance name, you can perform the following specific actions for that instance:
- View details - Refer to Viewing instance details for more information.
- Refresh data - Click this option to update information.
- Disable monitoring - Go to Disabling instances for more information.
- Remove - Refer to Removing instances for guidance on this section.
- Edit Properties - Refer to the Edit instance properties for more information.
Tip
You can also access an instance details view by clicking directly its name. Go to Viewing instance details, for more information on this view.
Status Area
On the right side of the dashboard, SQL Elements provides a summary overview of the status and contents of your environment that includes:
- The number of Instances that are up, down or critical.
- The number of Health Recommendations.
- The number of newly discovered instances. Click New Instances and SQL Elements displays the list of recently discovered instances. For more information, go to Discovered Instances.
- If the Auto-Registration option is off or on. You can click this option to enable or disable it. For more information, refer to Enable Automatic Registration.
- A summary of your environment with the number of instances, servers, databases, data size, and log size. You can click these options to access the following information
- Instances - Get a list of all managed instances.
- Databases - Get a view of your databases count filtered by tags.
- Data Size - Get a view of your data size filtered by tags.
- Log Size - Get a view of your log size filtered by tags.
- Disabled instances - Get a view of all your managed instances, ordered by status, with the disabled instances on top.
- Available licenses - Access this option to view your current license, add, or buy another one. For more information, refer to Managing licenses.
- A section of the most used Tags. You can click the pencil icon to manage all tags. For more information, refer to the Managing Tags section.
Tip
If you click on a tag name, SQL Elements displays a view of your environment´s data size by instance, filtered with the respective tag.
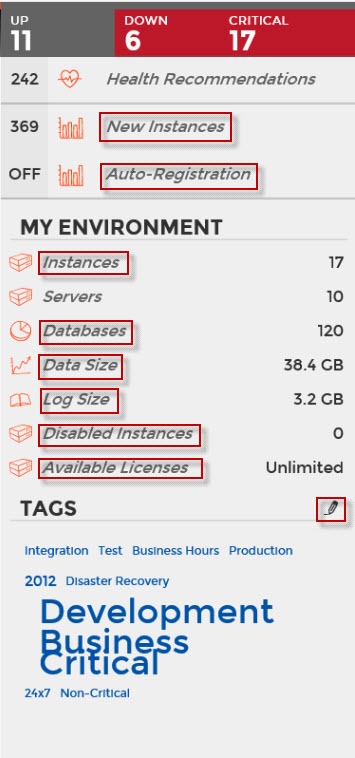
Tags font size represents the most used tags. The bigger the font size, the greater the number of tags that belong to that tag.