The left column displays a list of the monitored instances, allowing you to identify their status using specific icons for each possible status. Below is a description of each status:
ICON | STATUS |
|---|---|
 | Instance is active and there is data collected in the last 2 minutes |
 | Instance is inactive or unreachable |
 | Instance has been removed |
 | Unknown. No data collected in the last 2 minutes |
 | Stopped |
Select a time frame from the available options (30 seconds, 15 minutes, 1 hour, 4 hours, 1 day, 5 days, and 4 weeks) to retrieve the information.
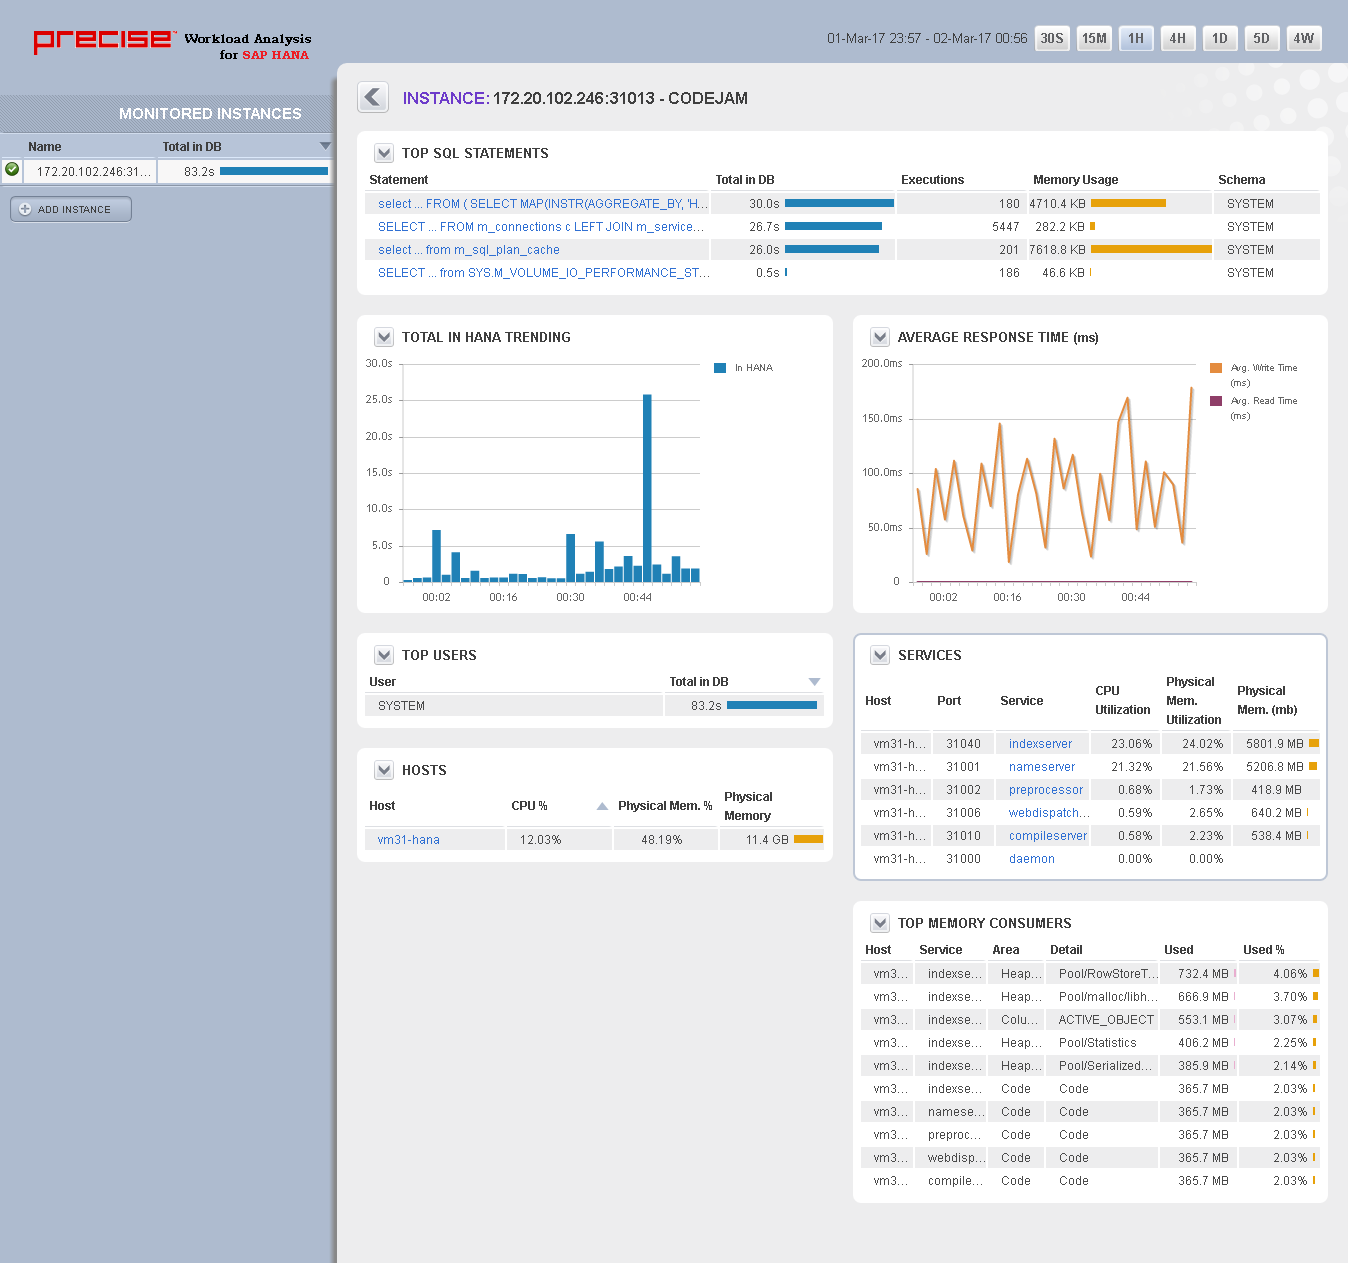
Dashboard Components
Total in HANA Trending
Displays information measured in seconds about In HANA.
Top Users
Provides a list of logins executed in the monitored instances. The list also defines the type of user, the total workload in the DB (measured in seconds), and the number of executions.
Top SQL Statements
Displays a list of the most frequently executed SQL statements, including queries and updates that have been performed on a specific monitored instance and/or a specific database. Each statement can be drilled down to obtain more detailed information. SQL Plan can also be seen on the drill down page.
Hosts
Displays a list of hosts involved in the monitored instances. Each host is shown with its average CPU and Physical Memory Usage in the selected time frame. Each host can be drilled down to obtain more detailed information.
Average Response Time
Shows a graph of Average Read time and Average Write time on the HANA Database.
Services
Shows a list of HANA services with their Host, Port, and Utilization of CPU and Physical Memory. Each service can be drilled down to obtain more detailed information.
Top Memory Consumers
Provides the list of top memory consumer services with their Area and Detail of memory consumption.
IDERA Website | Products | Buy | Support | Community | About Us | Resources | Legal