Page History
...
By default, the following IDERA SQL Compliance Manager widget appears on the IDERA Dashboard Overview:
- SQL Compliance Manager Environment Alerts
- SQL Compliance Manager Enterprise Activity Report Card
- SQL Compliance Manager Audited Instances
...
In the Overview tab, you can perform the following actions:
- Expand or collapse a widget
 .
. - View a widget in full size
 .
. - Remove a widget
 .
. - Filter widget information by Products and by Tags.
| Anchor | ||||
|---|---|---|---|---|
|
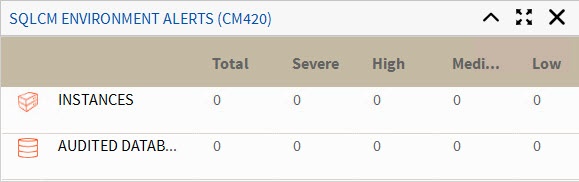
The SQL Compliance Manager Environment Alerts widget displays the number of active alerts for the entire environment with Severe, High, Medium, or Low status along with the:
- Total number of audited instances in your environment. Click Instances to access the Audited Instances view within SQL Compliance Manager.
- Total number of audited databases in your environment. Click Audited Databases icon to access the Audited Databases view within SQL Compliance Manager.
| Anchor | ||||
|---|---|---|---|---|
|
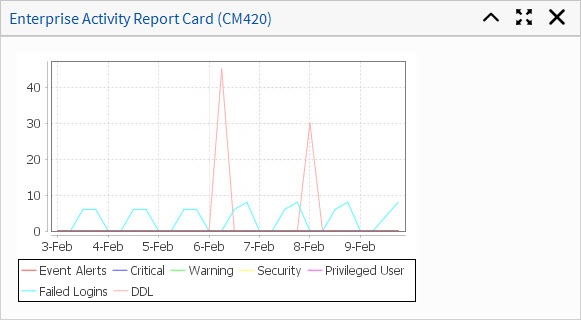
The SQL Compliance Manager Enterprise Activity Report Card widget displays your SQL Compliance Manager enterprise activity in a line graph based on the Overall Activity graph on the SQL Compliance Manager Enterprise Activity report Card. This graph displays activity for the past seven days and includes:
...
For more information about the Enterprise Activity report Card, see Explore Activity - Audited SQL Servers Summary tab.
| Anchor | ||||
|---|---|---|---|---|
|
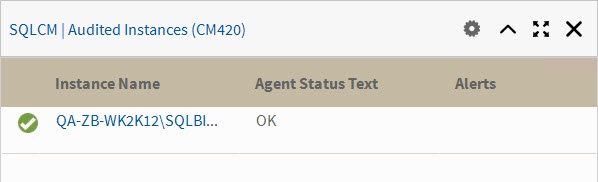
The SQL Compliance Manager Audited Instances widget displays a list of audited SQL Server instances. This widget includes:
- Status icon: green check for okay (successful connection and the SQL Server Agent is running) or red x for error (instance connection failed or the SQL server Agent is not running)
- Instance name
- Agent Status text
- Any available alerts
- Number of audited databases per instance (scroll right if not available)
| Scroll Pagebreak |
|---|