Page History
The Alerting option from the SQL Compliance Manager Menu Table-Data Access by Row count ... allows users to configure their preferred email and SNMP settings, as well as to groom undesired alerts on your SQL Servers. (Screenshot)
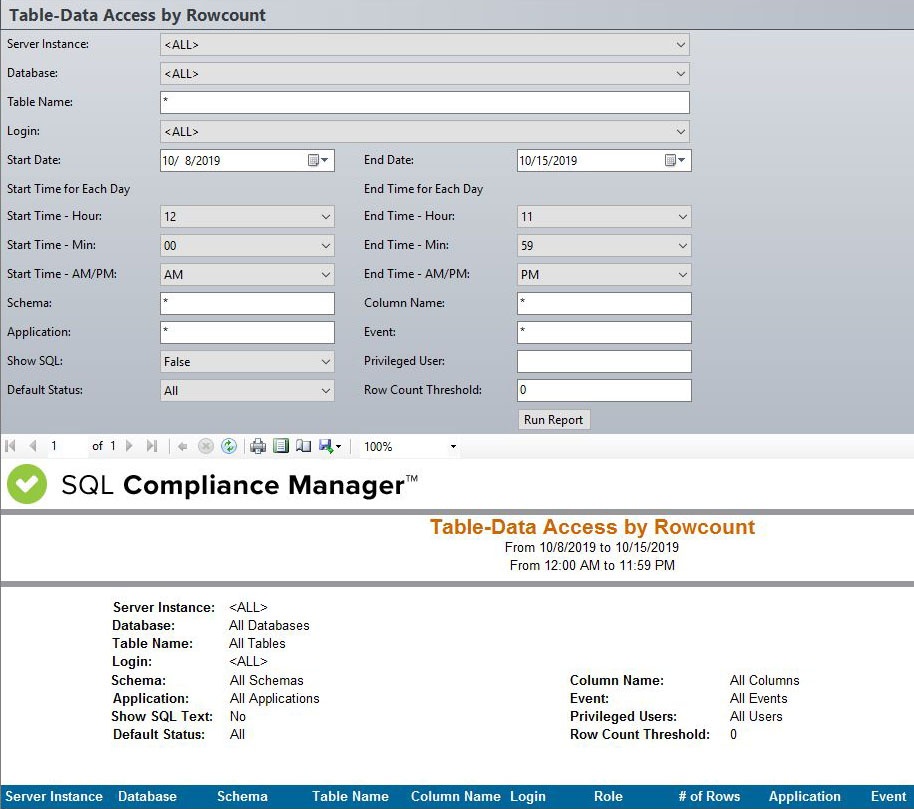
A filter can include a list of wildcards, separated by commas, where a wildcard is a string, which may contain asterisks. The following parameters are specific to the selected report and enable you to filter the data to include in the report.
Available actions
Server Instance
The
Databases
Table Name
Login
Start Date
The
End Date
The
Start Time of Day
End Time of Day
Schema
Column Name
Application
Event
Show SQL
Privileged User
Row Count Threshold
Allows you to select a registered instance on which you want to report. Select ALL to report on all instances.
Databases
Allows you to select or type the name of one or more databases on which you want to report.
Table Name
Allows you to select or type the name of one or more table names on which you want to report.
Login
Allows you type or select the login from the drop down list of available logins. Select ALL to report on all logins.
Start Date
Allows you to select the start date for the range from which you want to report.
End Date
Allows you to select the end date for the range from which you want to report.
Start Time - Hour
Allows you to select the exact starting hour of the day for the range from which you want to report.
Start Time - Min
Allows you to select the exact starting minute of the day for the range from which you want to report.
Start Time - AM/PM
Select between AM or PM from the drop down list to configure the Start Time for Each Day range from which you want to report.
End Time - Hour
Allows you to select the exact ending hour of the day for the range from which you want to report.
End Time - Min
Allows you to select the exact ending minute of the day for the range from which you want to report.
End Time - AM/PM
Select between AM or PM from the drop down list to configure the End Time for Each Day range from which you want to report.
Schema
Allows you type the name of the schema on which you want to report.
Column Name
Allows you to type the column names of one or more columns on which you want to report.
Application
Allows you to type the name of one or more applications on which you want to report.
Event
Allows you to type the name of one or more events on which you want to report.
Show SQL
Select between True or False from the drop down menu to filter the report by SQL Text.
Privileged User
Select between True or False from the drop down list to report on Privileged Users only or to report on All User types.
Default Status
Allows you to define the default status you want this report to filter on. Select between the following options; All, Same or Different.
Row Count Threshold
Allows you to type the number of Row count Threshold on which you want to report.
Run Report
Click this button to Run the report.
...
Default columns
Server Instance
The Server Instance column displays the name of the ... Instance Server where the event was captured.
Database
The Database column displays the name of the ... database where the event was captured.
Schema Name
The Schema Name column displays the name of the event´s schema...
Table Name
The Target Object Table Name column displays the name of the table where the event was captured...
Column Name
The ... Column Name column displays the name of the column where event was captured.
Login
The Login column displays the ... login name of the user who performed the event.
Role
Number of Rows
The Number of Rows column displays the number of rows affected.
Application
The Application column displays the ... name of the application used to capture the event.
Event
The Event column displays a description of the event captured.
Date/Time
The Date/Time column displays the date and time the event was captured.
SPID
The SPID column displays ...
SQL
...