...
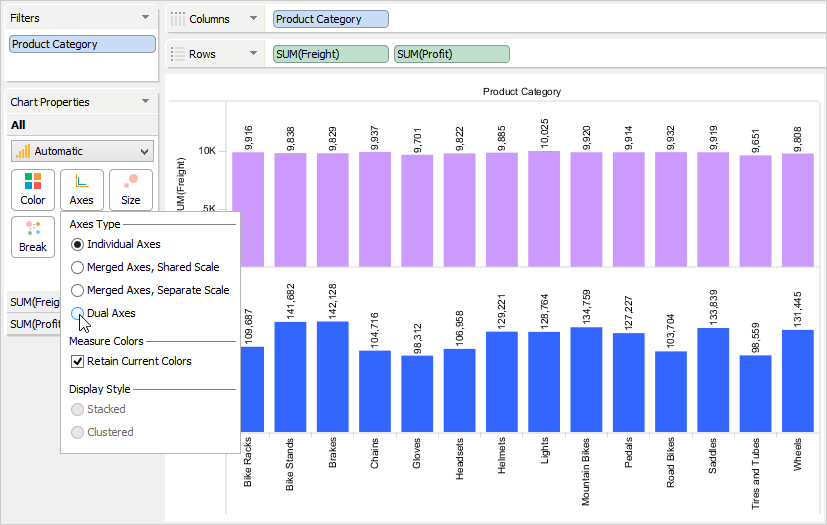
The settings within the Chart Properties > Axes allows you to select:
| Anchor |
|---|
| Individual Axes |
|---|
| Individual Axes |
|---|
|
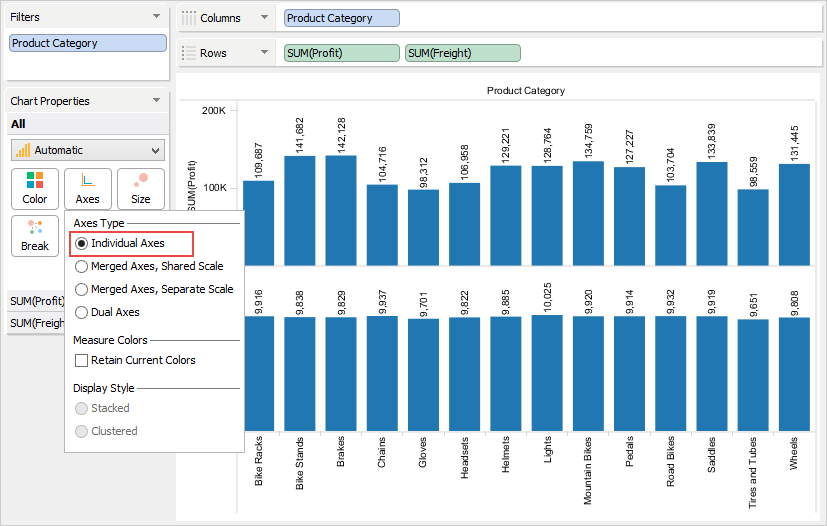
Individual AxesEach measure and dimension combination gets its own independently labelled chart in the chart view.
| Anchor |
|---|
| Merged Axes Shared Scale (Stacked) |
|---|
| Merged Axes Shared Scale (Stacked) |
|---|
|
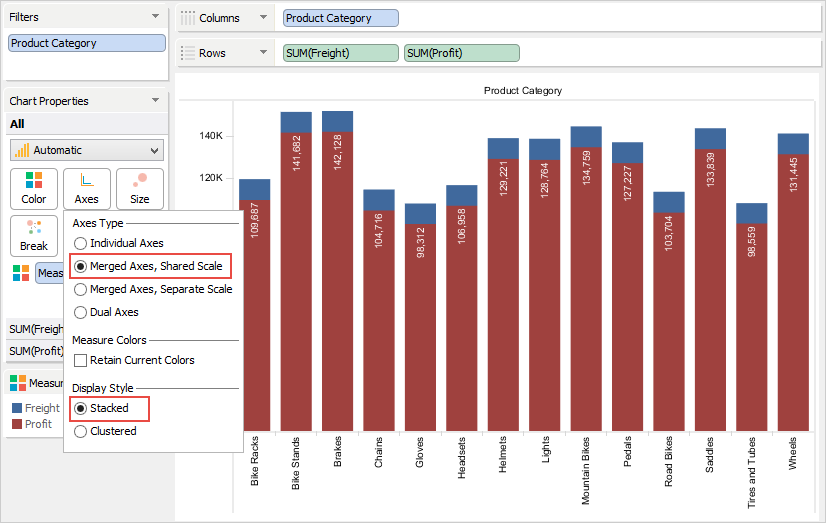
Merged Axes Shared Scale (Stacked)
Each measure and dimension combination share the same axis with one measure field cell on top of the other.
| Anchor |
|---|
| Merged Axes Shared Scale (Clustered) |
|---|
| Merged Axes Shared Scale (Clustered) |
|---|
|
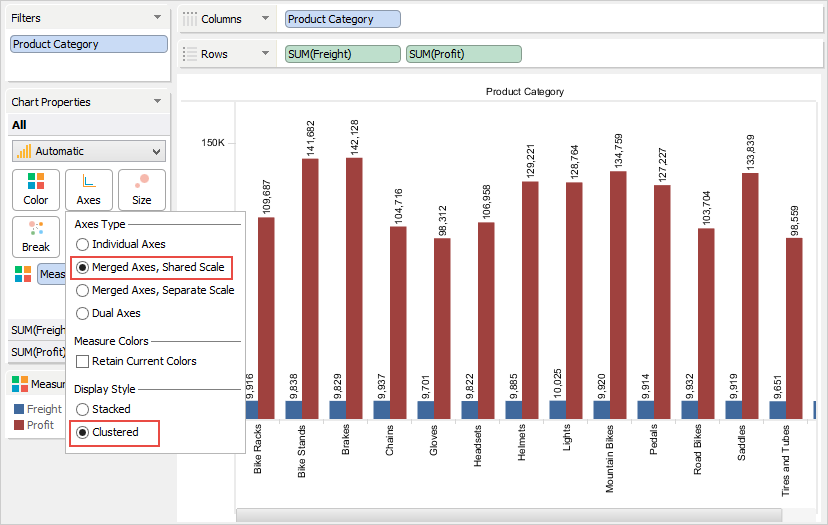
Merged Axes Shared Scale (Clustered)
Each measure and dimension combination share the same axis with measure field cells arranged side-by-side.
| Anchor |
|---|
| Merged Axes Separate Scale |
|---|
| Merged Axes Separate Scale |
|---|
|
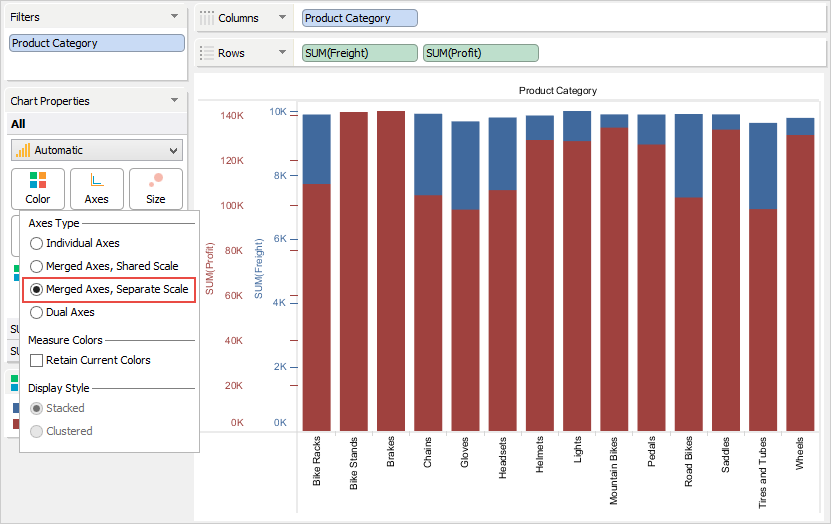
Merged Axes Separate ScaleEach measure and dimension combination has a separate color coded parallel axis. The color code is same as that applied to the measure.
Dual Axes Each side of the chart view displays a measure value range and label for a distinct measure with a different color for each measure name.
...
| Info |
|---|
If you want to control the measure tick marks, axis title, range and axis location shown on an axis, right-click the axis in the chart and select the Edit Axis option. |
| Anchor |
|---|
| Retain Current Colors |
|---|
| Retain Current Colors |
|---|
|
Retain Current Colors
You can retain the currently assigned colors for the measures when changing the axes type by using the Retain Current Colors check box.
...