Page History
The IDERA Web Console is a development that allows users to get an overview of the status of small and large SQL Diagnostic Manager deployments, which you can use on your computer or mobile device. To start navigating the IDERA Web Console, you must previously install and log in to IDERA Web Console.
The IDERA Web Console SQLDM web console interface boasts an easy-to-navigate dashboard comprised of several features such as views, sub-views, tabs, and widgets that provide a complete synopsis of your SQL Diagnostic Manager environment. Click the image to view full size.
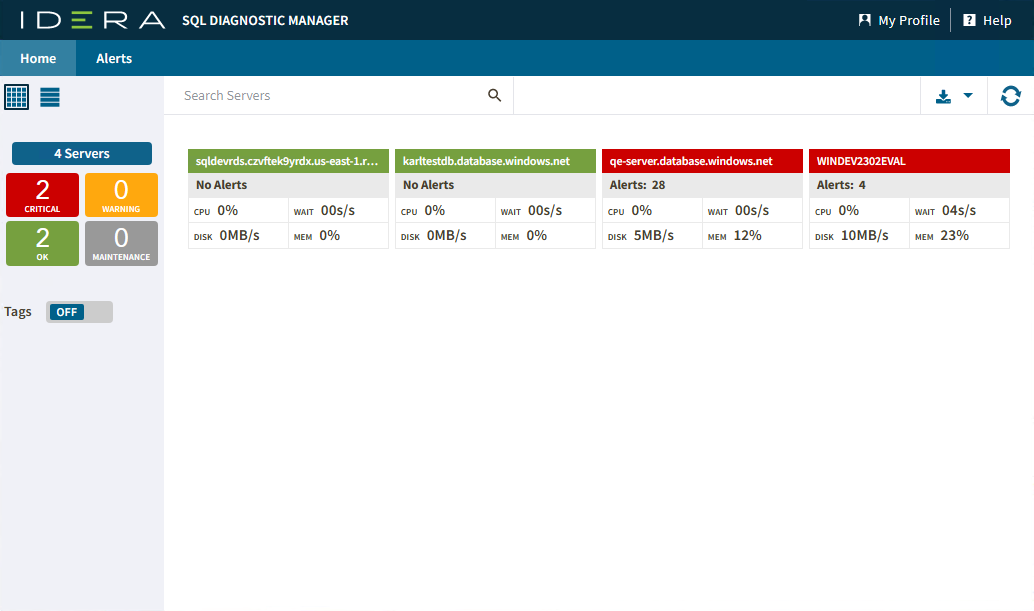
On the dashboard navigation screen, you can find the following sections:
- Views by Status, Tags, or Critical Instances
- List, thumbnail and heatmap sub-views
- Top X Lists tab
- Alerts tab
- Custom Dashboards tab
Additional options
Search
...
Home and the Alerts tab. In the Home tab, you can perform different actions such as:
- Get an overview of your environment.
- Identify and diagnose issues with sub-views.
- Other additional options.
Anchor Aditional_Options Aditional_Options
Additional options
| Aditional_Options | |
| Aditional_Options |
On the Home tab view, you can also find the following options which help you to manage your SQL Diagnostic Manager environments.
Search Server bar
You can search for a particular instance by name.
...
If you do not remember the full name of the instance
...
you are looking for, there is no problem, you can always type part of it, and IDERA Web Console will show you the instances containing your search.
Heatmap Calculation Configuration
...
Download
IDERA Web Console allows you to
...
download the current view in a PDF or Excel report file.
Refresh
The Refresh button allows you to manually refresh displayed data.