Page History
...
In this section, you can find the specific metrics of the selected instance. Such as CPU usage, SQL Disk I/O, SQL Memory usage, Average Response Time, Sessions, and Health Index., such as:
Server Name
Displays the server name of your instance.
CPU
Refers to the average percentage of SQL Server processor usage on the computer hosting the SQL Server instance.
Wait
Displays the Total Server Waits for the monitored SQL Server instance
RAM
Sessions
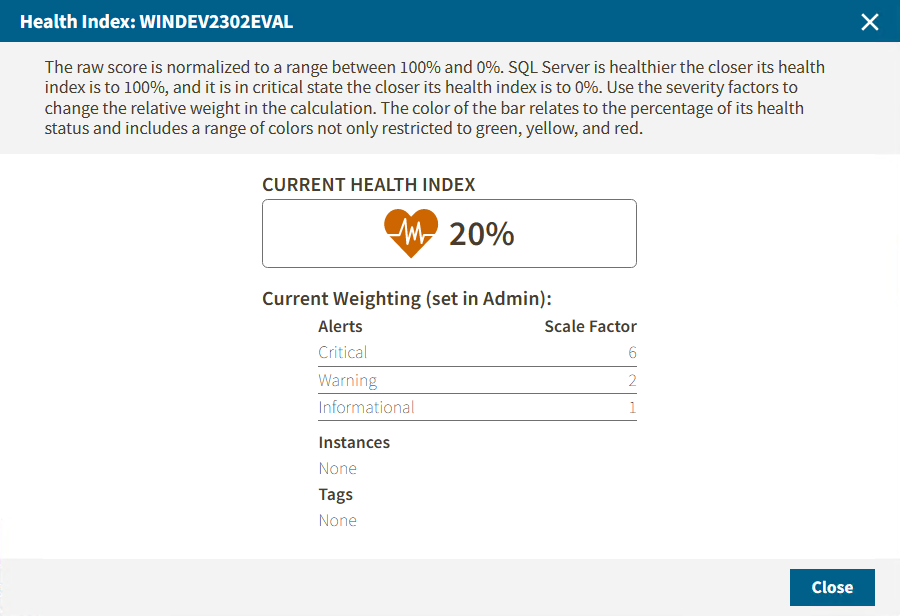
Health Index
Shows the current instance health in percentage. To have a wider view of this options click on the metric and the following window pops up.
Anchor charts charts
Charts
| charts | |
| charts |
The single instance dashboard includes the option Add Chart. Click it and the Manage Charts window pop up, allowing you to choose the graphs to be displayed in the overview single instance view.
...
The Virtual Memory Usage chart displays the amount of memory allocated and used by SQL Server to the total memory consumed on this VM or host server.
| Info |
|---|
If you want to expand a especific chart, click on the expand icon located at the top right side of the chart. |
| Anchor | ||||
|---|---|---|---|---|
|
The single instance dashboard summarizes the critical and warning alerts of your single instance in a detailed view, shown as follows.
...
In this view, you can review the following details in a list
Severity
Classifies the Alert severity as Critical, Warning, Ok, and Maintenance.
Change
Active
Time
Server Typer
Summary
Database
Metric
and organize under the following columns Severity, Change, Active, Time, Server Typer, Summary, Database, and Metric.
Besides, you can check all the alert's details in you select an alert and it will show you a new window with all the meaningful information of by double-clicking the alert.
