Page History
The single instance view includes an Overview and Sessions section sections for the selected monitored SQL server and specific category views.

In the single instance view, you can find the following sections:
Also it shows a summary of the
Anchor HR HR
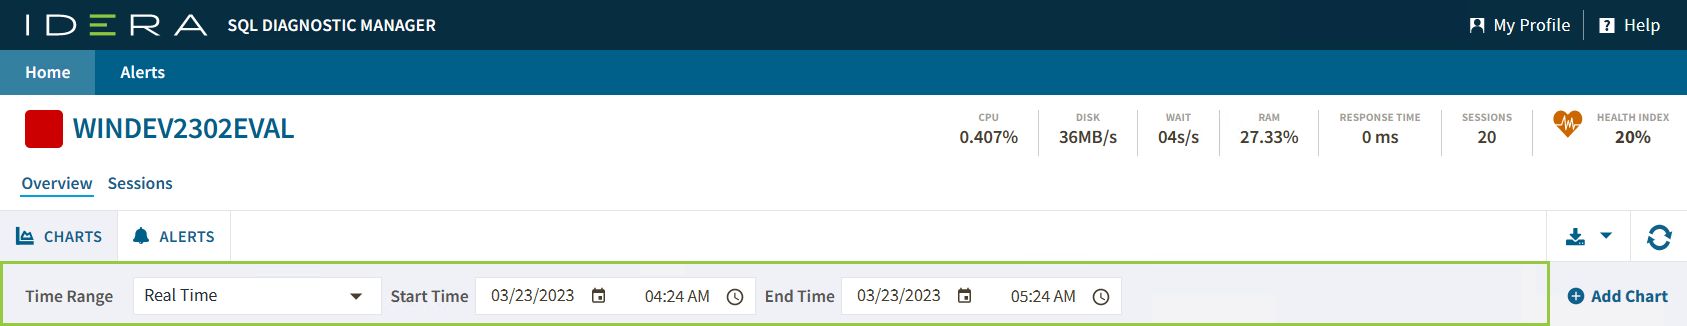
History Range Control
| HR | |
| HR |
IDERA Web Console also includes a History Range Control, located at the top of the Web Console. You can modify it by changing the start and end time and date.
Anchor AHS AHS
Status Summary
| AHS | |
| AHS |
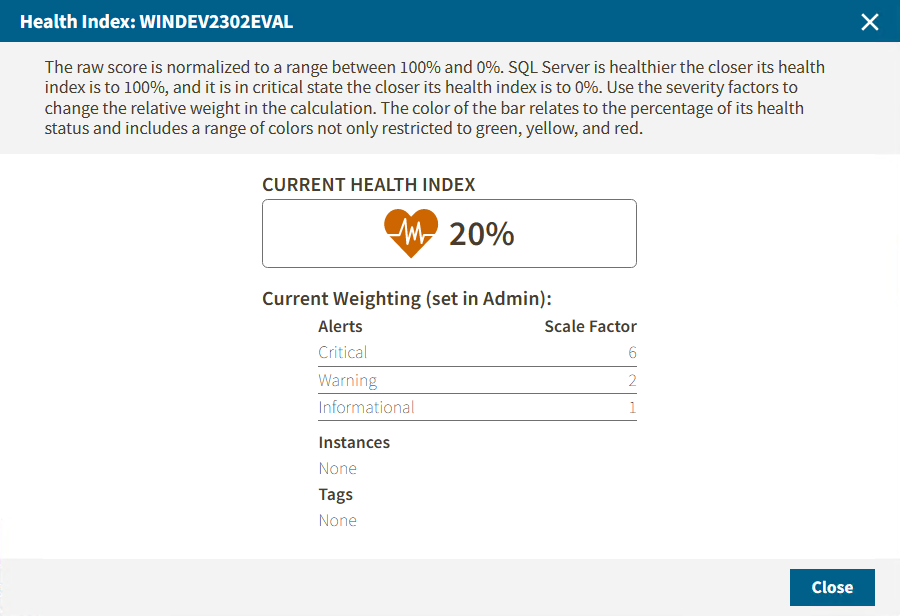
In this section, you can find the specific metrics of the selected instance, such as:
...
Shows the current instance health in percentage. To have a wider view of this option click on the metric and the following window will pop up.
Overview
In the single instance view, you can find the following
Anchor charts charts
Charts
| charts | |
| charts |
The single instance dashboard includes the option Add Chart. Click it and the Manage Charts window pop up, allowing you to choose the graphs to be displayed in the overview single instance view.
...