Page History
In the The single instance view provides the Overview sectionview, you can find the following sub-sectionswhich helps you to check your alerts in a graphic and detailed way with the following sections.
Anchor charts charts
Charts
| charts | |
| charts |
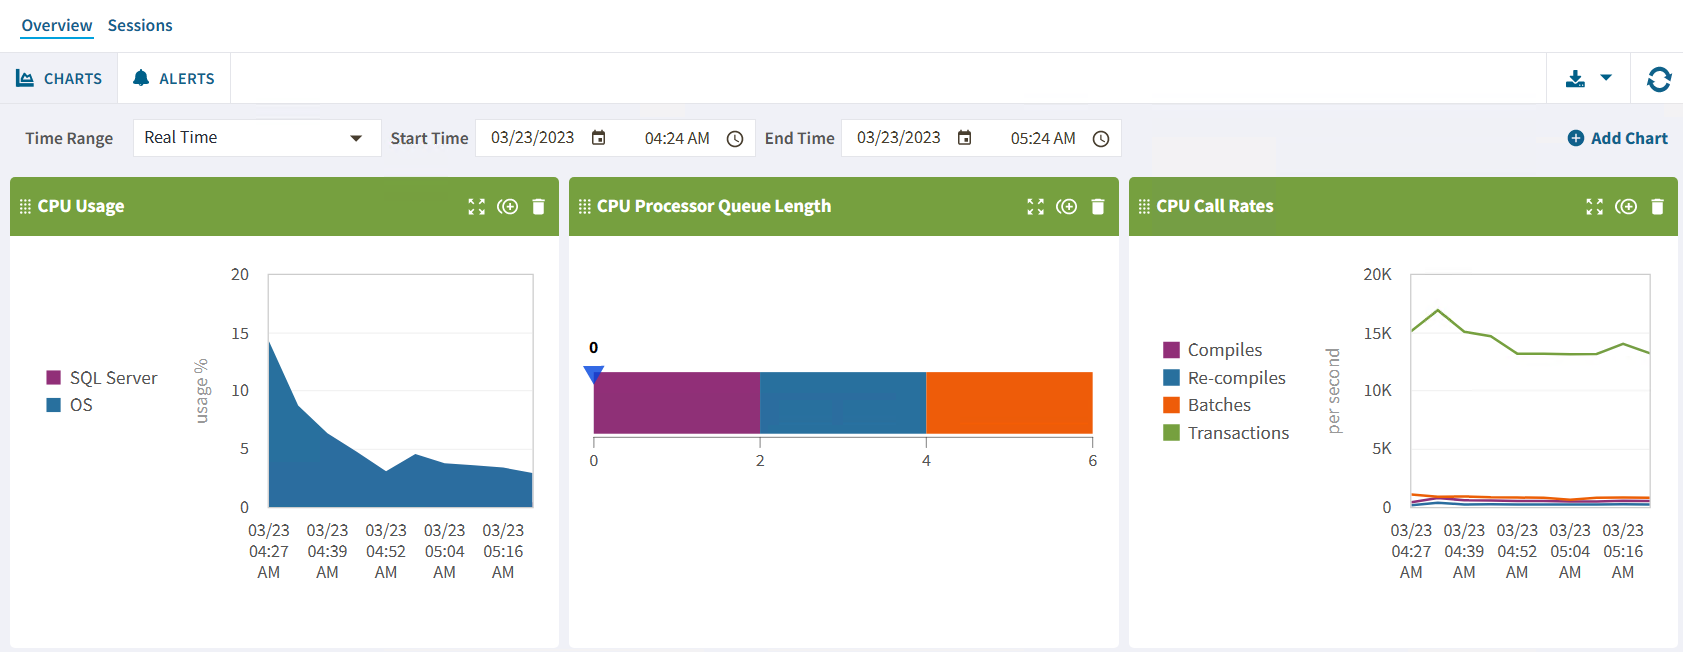
The Charts view provides you with complete graphic instance monitoring from the SQL Diagnostic Manager Server application. Each chart has the following capabilities:
- Drag and drop - To change the position of a chart, drag it by clicking the
 icon and moving the chart to the position you like.
 - Expand and contract - To get a wider view of the chart, click the
 icon.
icon. - Duplicate - To duplicate a chart click the
 icon.
icon. - Remove - To delete a chart from the overview view, click the
 icon.
icon.
| Info |
|---|
You can find the options above in the header of each chart. |
The single instance dashboard also includes the option Add Chart. Click it and the Manage Charts window will pop up, allowing you to choose the graphs to be displayed in the overview single instance view.
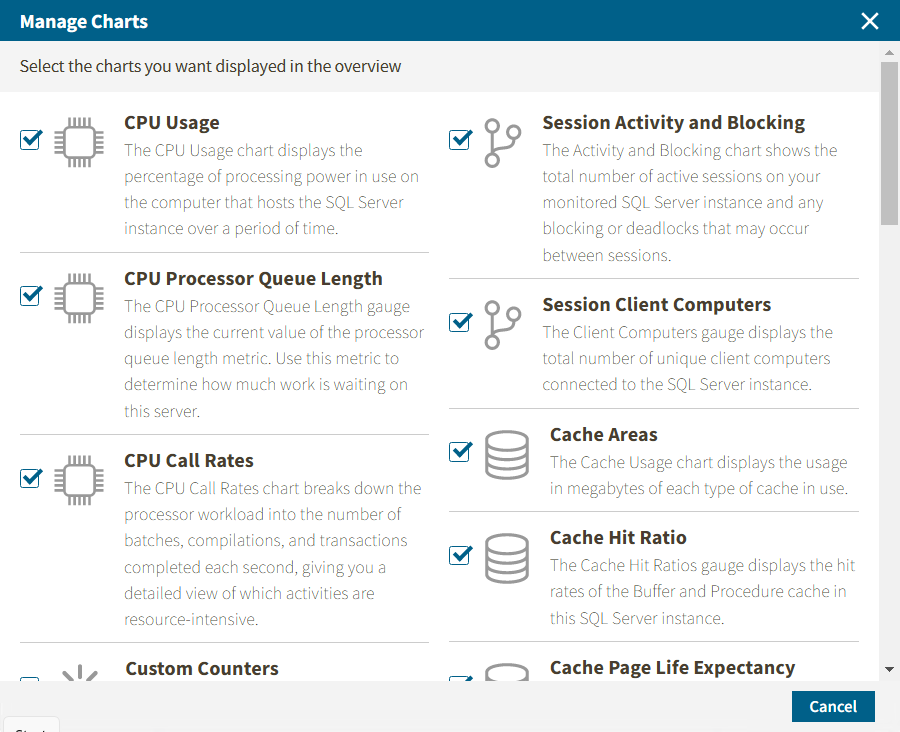
The Manage Charts window allows you to choose as many charts as you want from the following options:
...
The Virtual Memory Usage chart displays the amount of memory allocated and used by SQL Server to the total memory consumed on this VM or host server.
...
...
If you want to expand a especific chart, click on the expand icon located at the top right side of the chart.
| Anchor | ||||
|---|---|---|---|---|
|
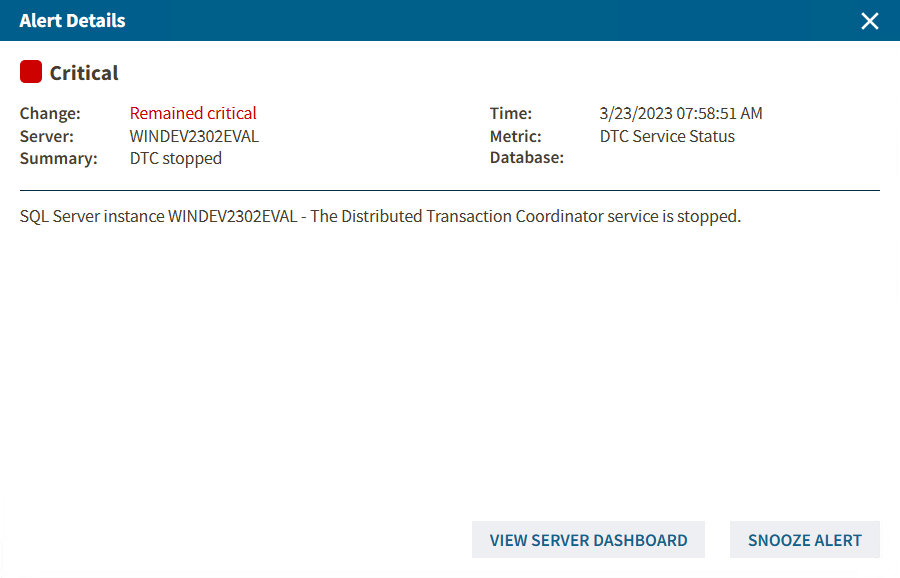
The single instance dashboard summarizes the critical and warning alerts of your single instance in a detailed view, shown as follows.
In this view, you can review and organize under the following columns Severity, Change, Active, Time, Server Typer, Summary, Database, and Metric.
Besides, you can check all the alert 's details in a new window with all the meaningful information by double-clicking the alert.