Page History
The Sessions tab of the single instance dashboard provides you with the Sessions tab which allows you to quickly view key diagnostic statistics for sessions on your SQL Server SQL Server instance and contains the Overview and Session Graphs views. Click image to view full size.

Overview
following views:
Anchor Listing Listing
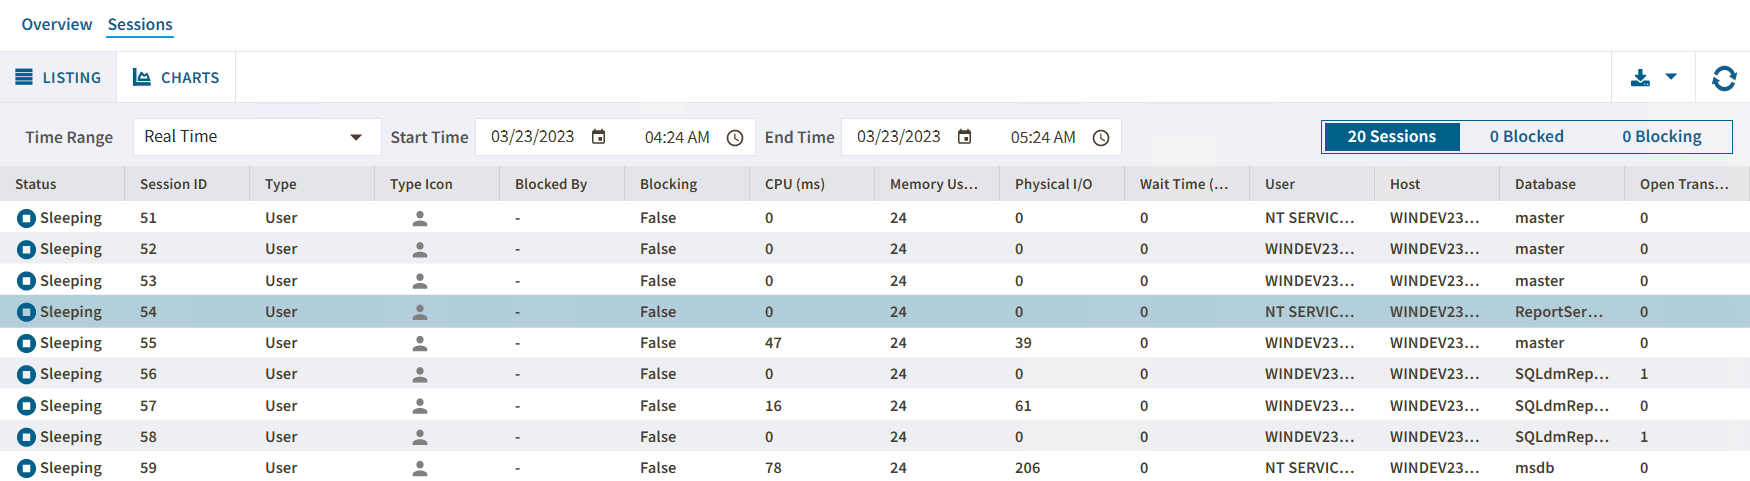
Listing
| Listing | |
| Listing |
The Listing view helps you to monitor your SQL Server instances with The Sessions > Overview tab contains the following information:
- Status
- Session ID
- Type
- HostDatabase
- Blocked By
- Status
- Open transactions
- Command
- Application
- Blocking
- CPU (ms)
- Memory Usage
- Physical I/O
- Wait Time Wait time (ms)
- Wait type
- Wait resources
- User
- Host
- Database
- Open Transaction
- Command
- Application
- Execution Context
- Wait Type
- Wait Resource
- CPU Delta CPU (ms)CPU Delta (ms)
- Loging Time
- Physical I/O
- Memory
- Login timeDelta
- Last Batch
- Blocked by
- Blocking Count
- Blocking count
- Net addressAddress
- Net library
- Version store elapsed (sec)
| Tip | ||
|---|---|---|
| ||
You can export sessions overview information in the following formats: PDF, XLS, or XML. |
...
- Library
- Version Elapsed Seconds
- Transaction
- Current Session
- Session User Space Allocated (kb)
- Session User Space Deallocated (kb)
- Current Task User Space (kb)
- Task User Space Allocated (kb)
- Task User Space Deallocated (kb)
- Current Session Internal Space (kb)
- Session Internal Space Allocated (kb)
- Session Internal Space Deallocated (kb)
- Current Task Internal Space (kb)
- Task Internal Space Allocated (kb)
- Task Internal Space Deallocated (kb)
- Last Command
You can configure the columns displayed in the Listing view by clicking the option ![]() icon, hovering the mouse over the column option, and choosing the metrics of your interest.
icon, hovering the mouse over the column option, and choosing the metrics of your interest.
Besides displaying diagnostic statistics of the monitored SQL Server instance, the Lisinting view allows you to perform the following actions:
Filter Information
The Sessions view presents two ways of filtering your session instance information.
The first one, consists
Check Session Details
Anchor Chart Chart
Charts
| Chart | |
| Chart |
The Sessions > Sessions Graphs tab contains the following charts (Click image to view full size):
...