Page History
...
- In the IDERA SQL Diagnostic Manager Quick Start window, click Install SQL Diagnostic Manager.
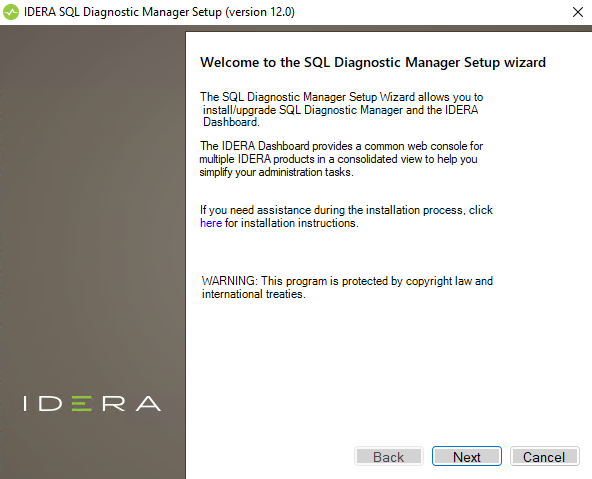
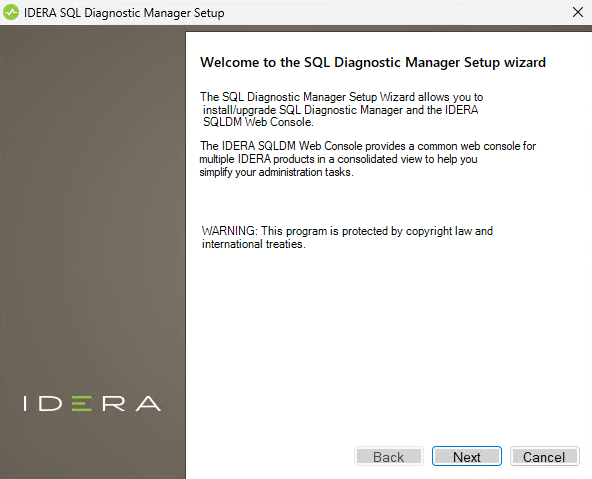
- In the Welcome to the SQL Diagnostic Manager Setup Wizard screen, click Next.
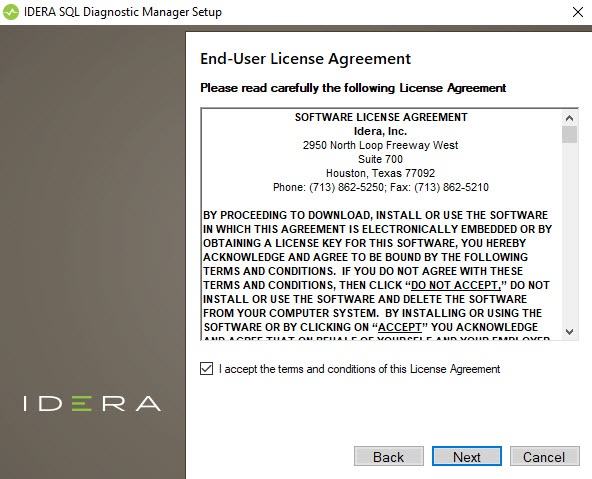
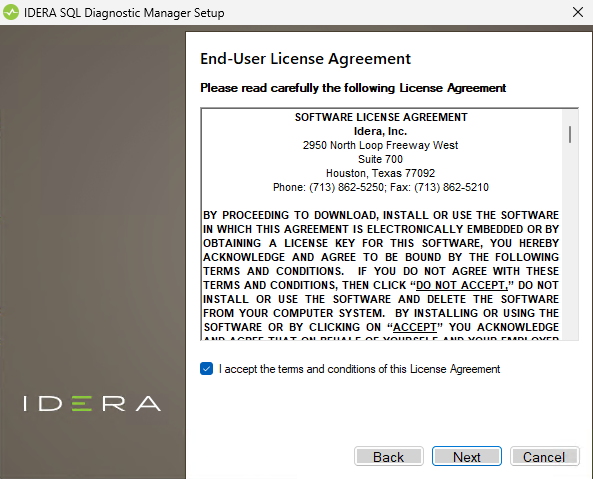
- Accept the terms and conditions of the End-User License Agreement, and click Next.
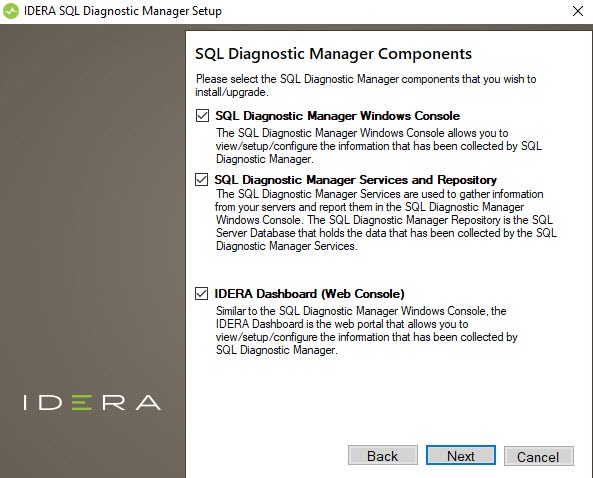
- Select the SQLDM Console, SQLDM Services and Repository, and the IDERA Dashboard components SQLDM Web Console components and click Next.
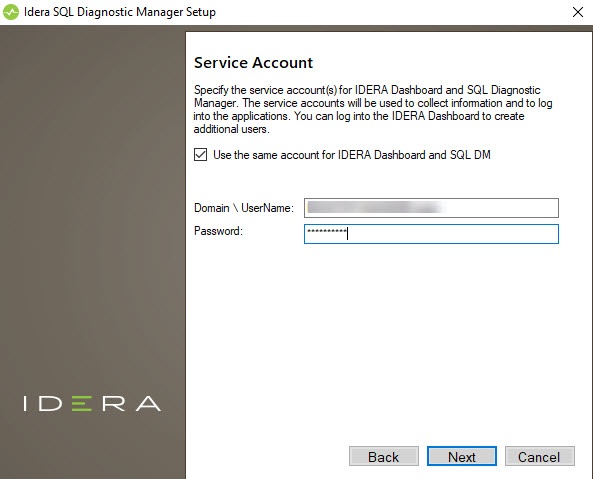
- Enter the credential to be used by the IDERA services and click Next.
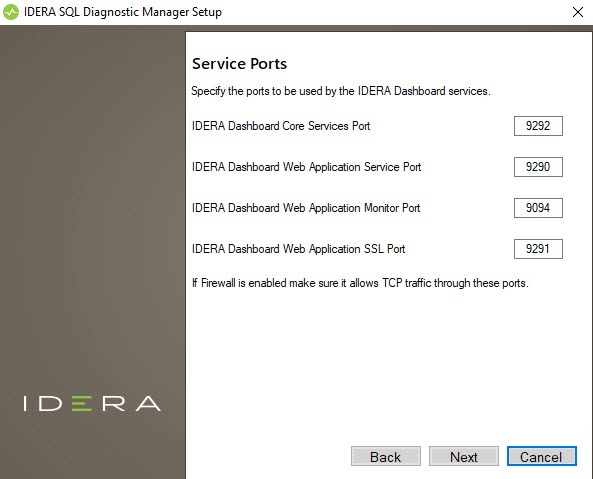
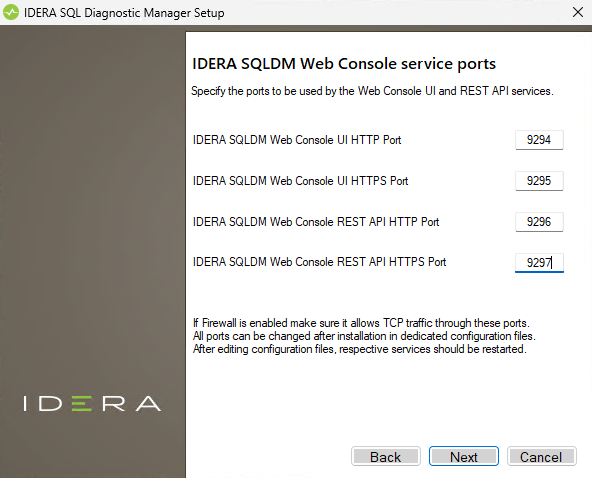
- Review the ports that are to be used by the IDERA Dashboard SQLDM Web Console services and click Next.
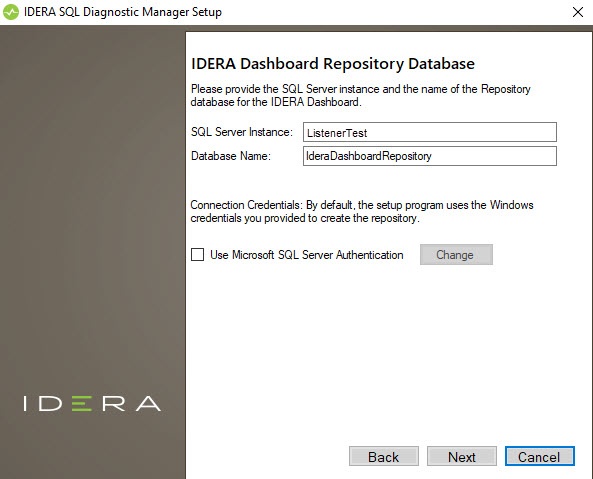
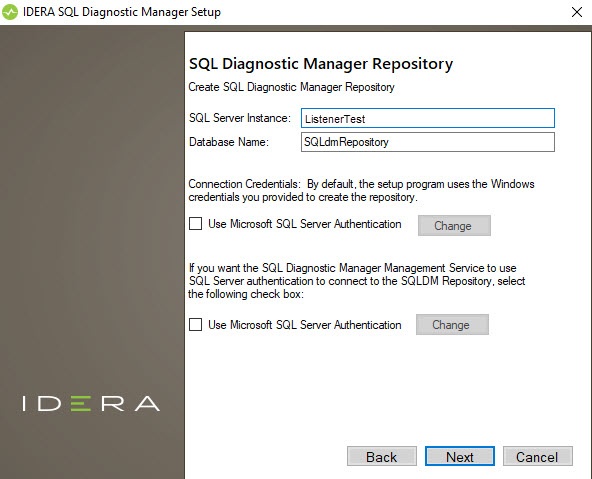
- In the IDERA Dashboard Repository Database screen specify the listener name Specify the SQL Server instance and database name for the SQL Diagnostic Manager Repository and click Next.
Specify the listener name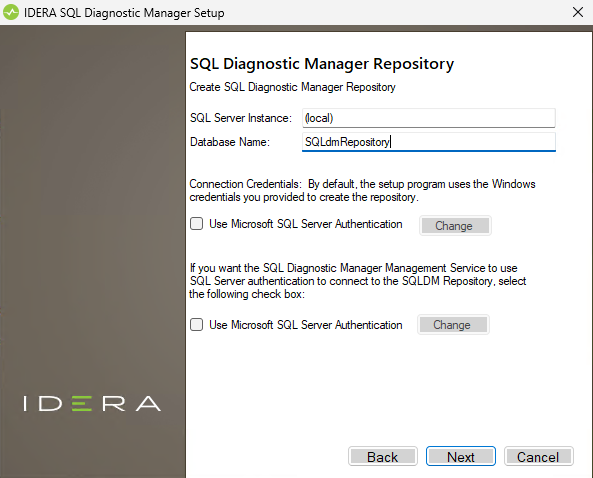
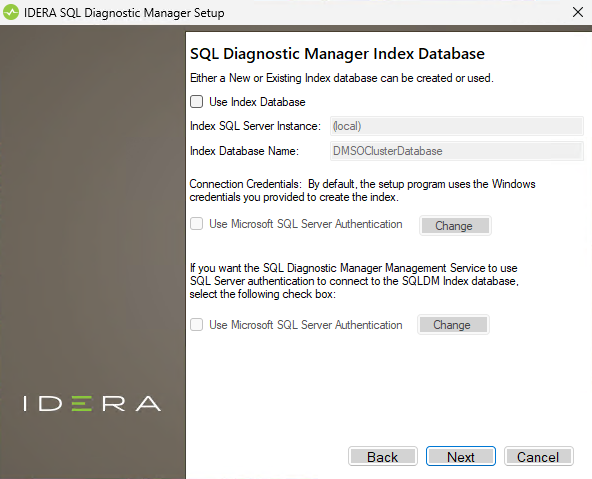
In case you want to monitor more than one SQL Diagnostic Manager installation, check the Use Index Database checkbox, specify the SQL Server instance and database name
for the SQL Diagnostic Manager Repository Database, set the credential configuration of your preference, and click Next.
Otherwise, skip this step by clicking Next.
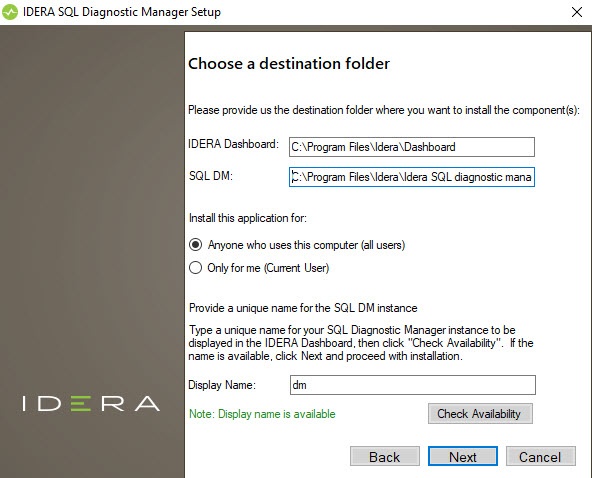
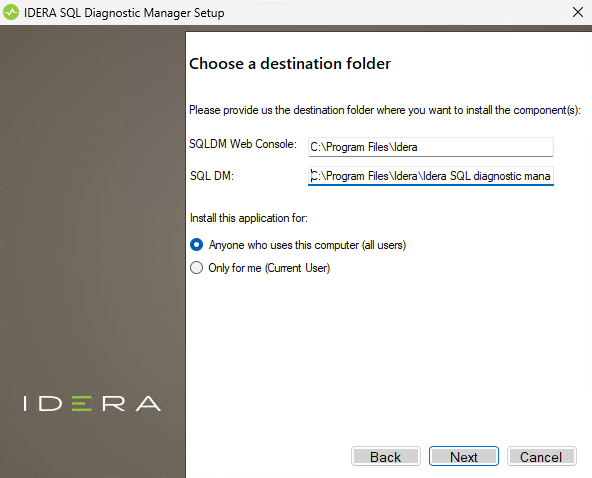
Provide the installation directory for the
IDERA DashboardSQL DM Web Console and SQL Diagnostic Manager
, enter a Display name, check the availability of the name,and click Next.
- If the specified paths do not exist on the system, the following window prompts. Click Yes to proceed.

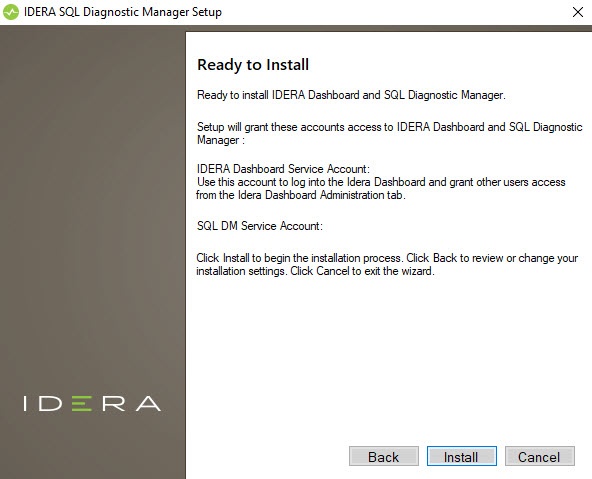
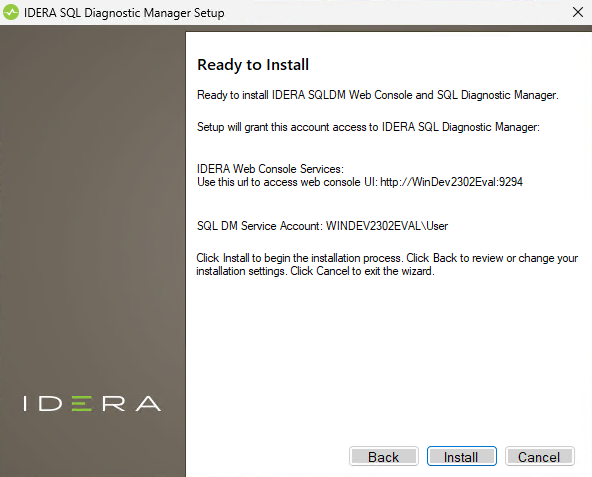
- Click Install to start the installation.
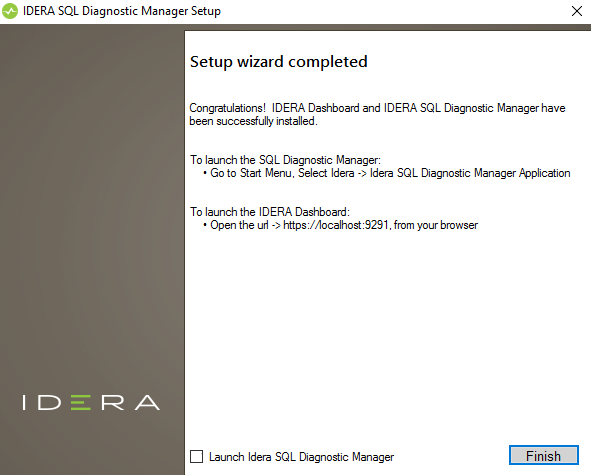
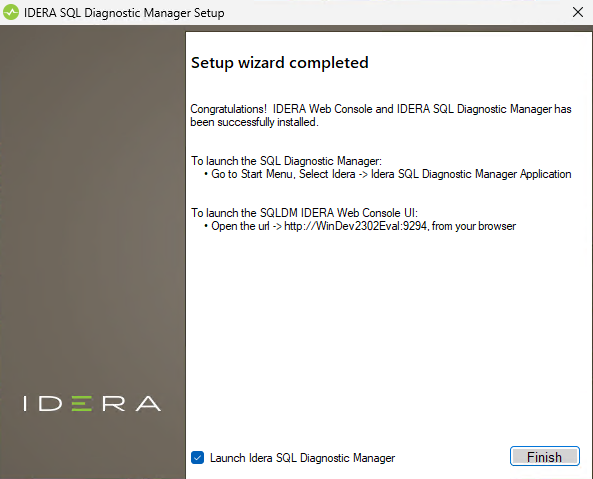
- After the installation has been completed, disable the Launch IDERA SQL Diagnostic Manager checkbox and click Finish.
Configure the Databases for High Availability
- Open SQL Server Management Studio (SSMS) on the primary node and connect the listener name.
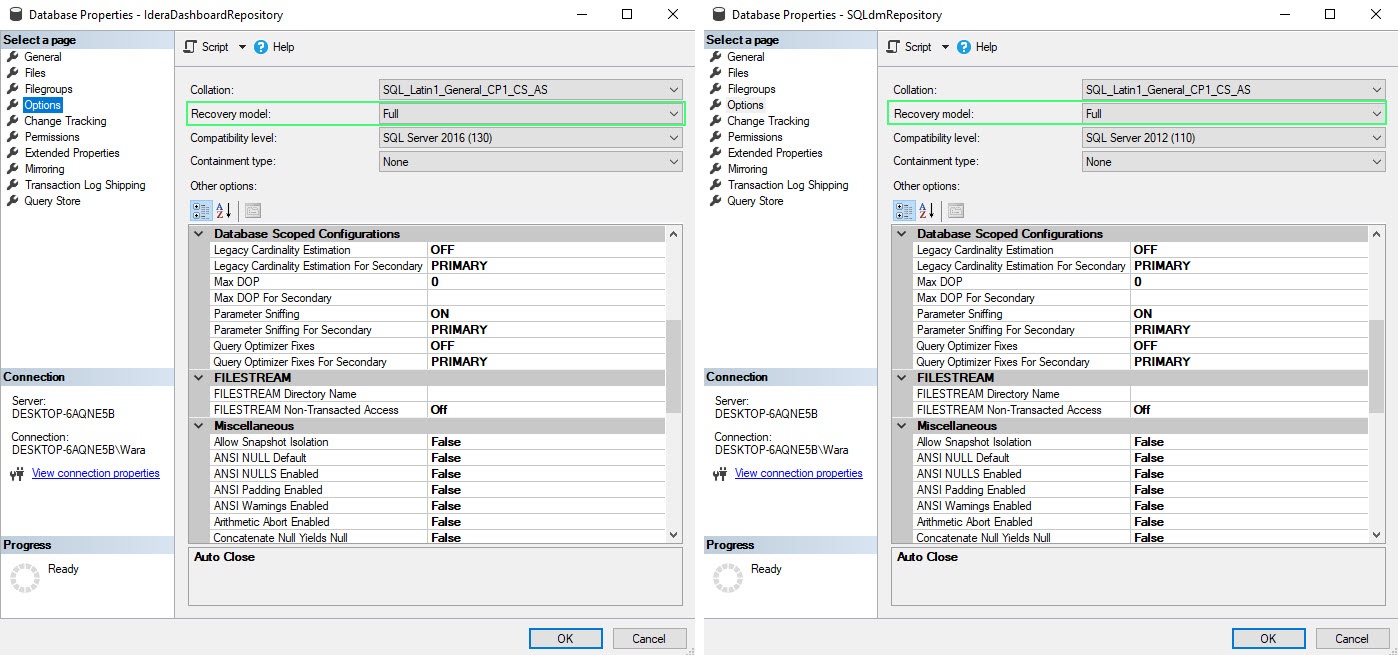
- Set the Recovery Model of the IderaDashboardRepository and SQLdmRepository databases to Full.
- Perform a full backup of the IderaDashboardRepository and SQLdmRepository databases.
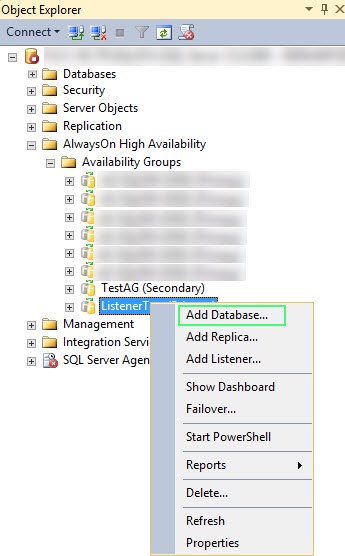
- Right-click the appropriate availability group and select Add Database...
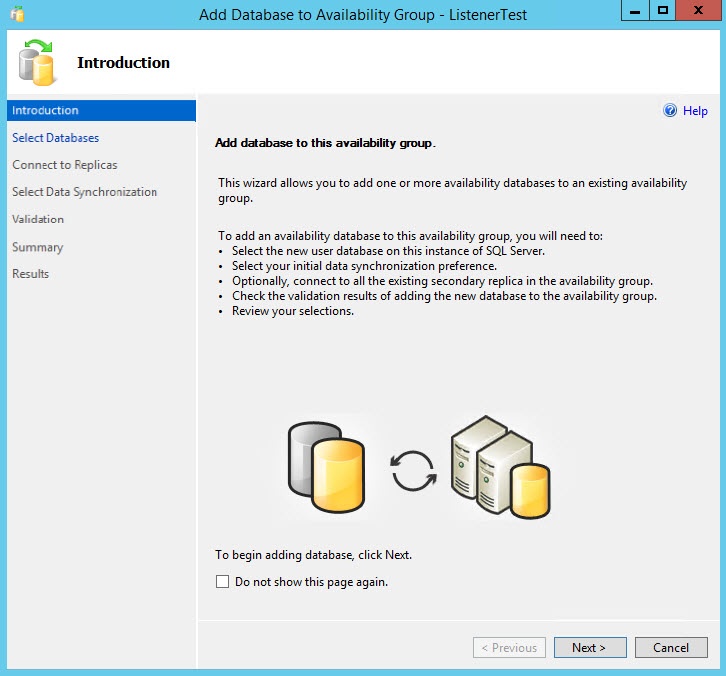
- On the Introduction screen of the Add Database to Availability Group wizard, click Next.
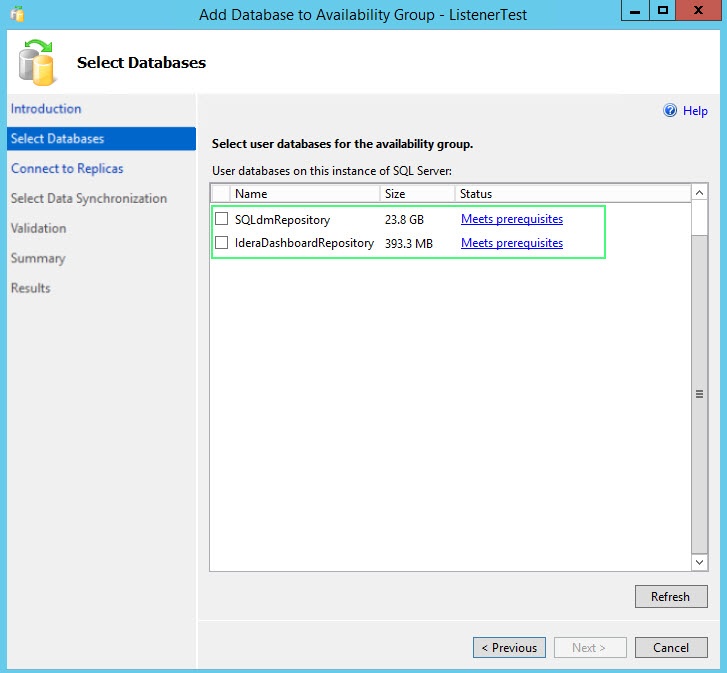
- On the Select Database tab, select the IderaDashboardRepository and SQLdmRepository databases, and click Next.
- On the Connect to Replicas tab, connect to the other replica(s) in the availability groups by clicking Connect... next to the Server Instances, and click Next.
- On the Select Data Synchronization tab, select one of the following options for your environment, and click Next.
- Automatic Seeding
- Full database and log backup
- Join only
- Skip initial data synchronization
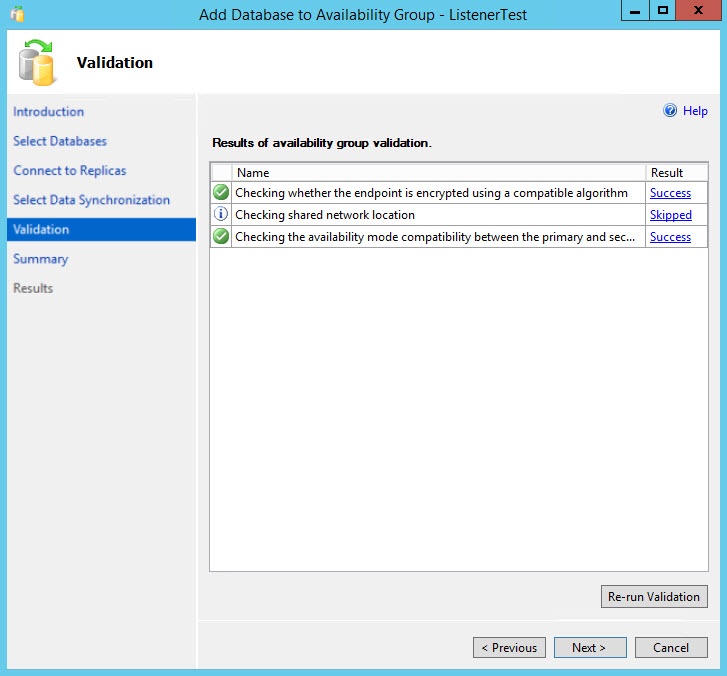
- On the Validation screen, ensure that all tests are successful and click Next.
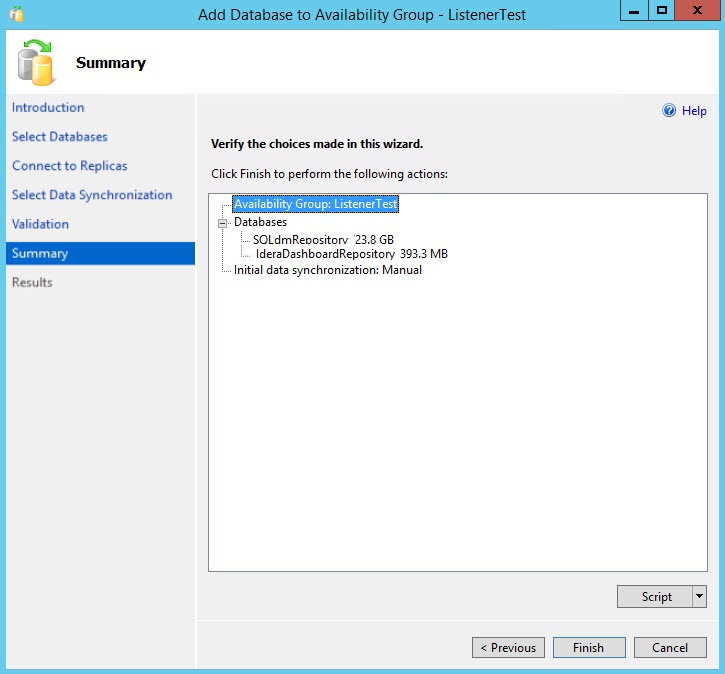
- On the Summary screen, verify the actions you selected in the previous steps, and click Finish.
- The Results screen displays the summary of the performed actions and their results, click Close to exit the wizard.
- In SSMS connect to the secondary replica(s) and ensure that the databases were added successfully.
- On the server where SQL Diagnostic Manager is installed, restart the services listed below:
- IDERA Dashboard Core Service
- IDERA Dashboard Web Service
- SQLdm Collection Service
- SQLdm Management Service
- SQLdm Predictive Analytics Service
- SQLdm Rest Service
...
- To validate the SQL Diagnostic Manager configuration, launch the Desktop Client.
- Go to

 > Manage License. In the New Key section, you should see the name of the listener and the port instead of the primary node name.
If you see the listener and port as shown in the image above, you have successfully configured the repository databases in an availability group.
...