Use the Alert Response window to create or modify your new alert response rule.
Access the Alert Response window
...
Trigger a response only if multiple metrics in the specified list reach the specified threshold(s). Click metric, and then select metrics to include in the alert response trigger. Click Select all to include all of the displayed metrics.
Where metric severity has changed
...
Action providers allow you to select actions that you want to occur as part of the alert response. By default, all actions are disabled. To enable an action, click Enable next to the appropriate action. The following actions help you manage alert response rules:
When the criteria for the new alert rule is met, SQL Diagnostic Manager sends an alert email message to the SMTP server, which then forwards the message to the specified email address. Configure your email settings and network manager settings to receive these alert email messages.
When the criteria for the new alert rule is met, an entry to the EventLog is created.
When the criteria for the new alert rule is met, SQL Diagnostic Manager sends an SNMP Trap message to the network management console based on the configuration of your email settings and network management settings.
PowerShell Action Provider
...
- Enable the PowerShell Action provider and the PowerShell Action dialog displays.
- Enter a description for the PowerShell command in the Description field.
- Either type in the PowerShell command you want to run when the alert criteria is met, or paste in the PowerShell command from another application.
- Click Test to verify your PowerShell command.
- Click OK.
| Anchor |
|---|
| prescriptiveprovider |
|---|
| prescriptiveprovider |
|---|
|
Prescriptive Analyzer Action Provider
When the criteria for the new alert rule is met, it triggers the Prescriptive Analyzer to run a prescriptive analysis on a specific server based on selected performance categories.
...
- Enable the Prescriptive Analyzer provider and the Prescriptive Analysis Settings window displays.
- Select the performance categories of your choice.
- Click OK.
| Anchor |
|---|
| programprovider |
|---|
| programprovider |
|---|
|
Program Action Provider
When the criteria for the new alert rule is met, you can specify a program for the SQLdm Management Service to run in response to the alert.
...
- Enable the Program Action provider and the Program Action dialog displays.
- Enter a description for the Program action.
Enter the full path to the program you want to launch as an alert response. Use the More Options drop-down menu to select from common runtime arguments.
| Tip |
|---|
You can run executable (.exe) files only through the Program Action Provider. If you need to run a batch (.bat) file, use cmd /c run.bat. |
Enter the full path of the directory in which you want the program to run.
| Tip |
|---|
The Start in field is useful when you want a different directory for where an action begins and where the program resides. |
- Click Test to make sure that the SQLdm Management Service can run the program.
- Click OK.
| Anchor |
|---|
| querymonitorap |
|---|
| querymonitorap |
|---|
|
Query Monitor Action Provider
When the criteria for the new alert rule is met, it triggers the Query Monitor to start so that you can collect more information.
...
SCOM Alert Action Provider
When the criteria for the new alert rule is met, SQL Diagnostic Manager sends an alert to SCOM.
To create SCOM alert response:
- Send to SCOM as Alert option.
- Select the metrics you want to be sent to SCOM as alerts. You can also select all available metrics.
- Click OK.
...
To create SCOM alert response:
- Send to SCOM as Event option.
- Select the metrics you want to be sent to SCOM as alerts. You can also select all available metrics.
- Click OK.
...
When the criteria for the new alert rule is met, SQL Diagnostic Manager sends an alert to ServiceNow.
To enable ServiceNow as an alert response:
- Enable Send ServiceNow as Alert option.
- Provide the following information regarding the ServiceNow configuration:
- Provider Name. By default, ServicerNow Action Provider
- URL.
- User Information
- Username.
- Password.
- Alert Source. By default, SQL Diagnostic Manager.
- Click OK.
| Info |
|---|
Keep in mind that you should have a web_service_admin or rest_admin user role for basic authentication for ServiceNow integration. |
| Info |
|---|
Consider that the Provider Name and the Alert Source are descriptive fields. You can leave them with default values or edit them to your preference. |
SQL Agent Job Action Provider
When the criteria for the new alert rule is met, you can specify a SQL Agent Job to run in response to the alert.
To start a SQL Agent Job as an alert response:
- Enable the SQL Agent Job Action provider and the SQL Agent Job Action dialog displays.
- Select the SQL Server instance from the Server drop-down list or select %(Instance) to run the SQL Agent Job on the server that caused the alert.
- Click Browse next to the Job Name field.
- On the Select Job window, select the SQL Server instance the SQL Agent Job is located on and click Load.
- Select the SQL Agent job from the list and click OK.
- If you want to select a particular Job Step to run, click the Browse button in the Job Step window
- In the Select Job Step window click Load.
- Select the Job step from the list and click OK.
- Click Test to verify your configuration.
- Click OK.
| Anchor |
|---|
| sqlscriptprovider |
|---|
| sqlscriptprovider |
|---|
|
SQL Script Action Provider
When the criteria for the new alert rule is met, you can specify a SQL Server script to run in response to the alert.
...
- Enable the SQL Script Action provider and the SQL Script Action dialog displays.
- Enter a description for the SQL Script Action in the Description field.
- Click Browse to select the SQL Server instance or leave it at the default of %(Instance) to run the SQL Script on the server that caused the alert.
- Either type in the T-SQL you want to run when the alert criteria is met, or paste in the T-SQL from another application.
- Click Test to verify your SQL script.
- Click OK.
Change the condition value
You can edit the rule description by clicking the underlined value from the Step 3 section. SQL Diagnostic Manager displays a list of currently defined items for you to select as the new value. Make the necessary updates, and then click OK.
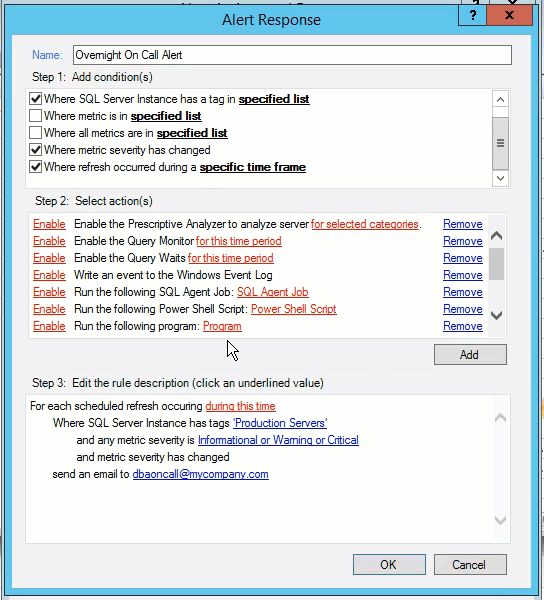 Image Modified