Page History
...
Steps to view the log files and OS information:
1. Before using SkySQL OS and Log Monitoring, generate a SkySQL API Key:
https://mariadb.com/docs/skysql-previous-release/security/api-key/#Generate_a_SkySQL_API_Key
Make sure the Observability API scopes are enabled for your API Key, as described here:
https://mariadb.com/docs/skysql-previous-release/security/api-key/#SkySQL_API_Key_Scopes
| Note |
|---|
| Note: These links are part of MariaDB SkySQL previous release documentation. |
2. Obtain the Server Datasource ID for each node you want to monitor in SQL DM:
Open the MariaDB SkySQL dashboard, accessible via https://skysql.mariadb.com/dashboard
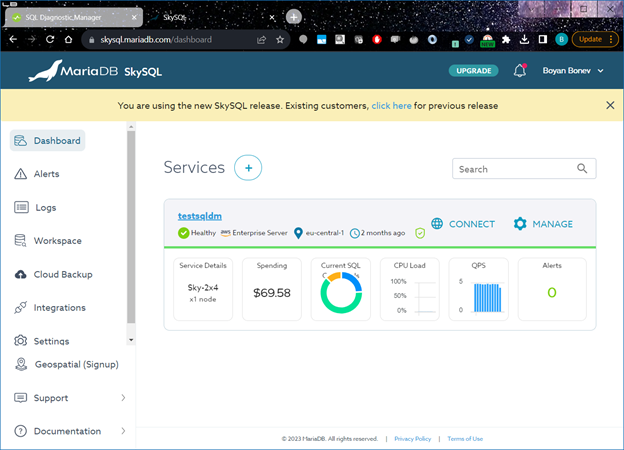
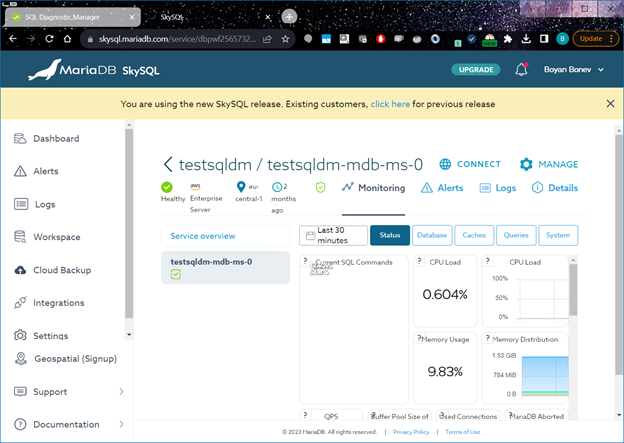
Click the service (for example testsqldm) to view the nodes running this service:
In the Connect window, you need the node name (for example testsqldm-mdb-ms-0) and username (for example dbpwf25657325):
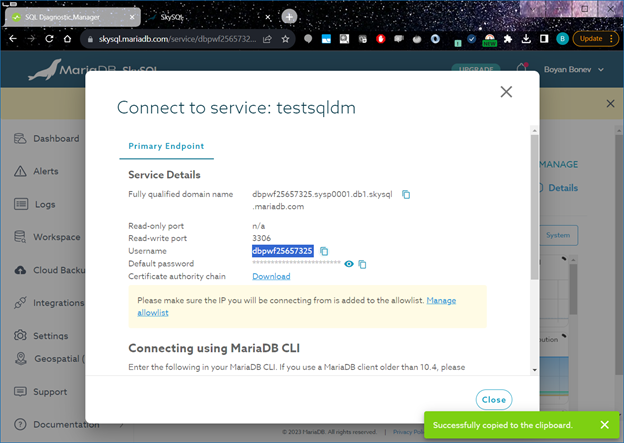
To make up your Server Datasource ID in the format:
...
username/node_name
For our example this
...
is dbpwf25657325/testsqldm-mdb-ms-0
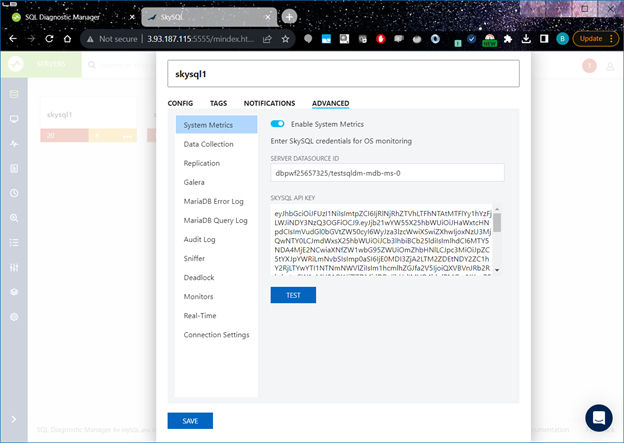
3. Enable the System Metrics feature for the MariaDB SkySQL server connection and fill the Server Datasource ID and API Key from previous steps:
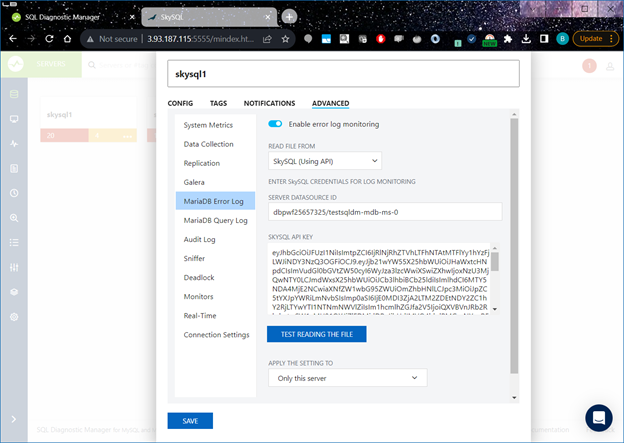
4. For MariaDB Error Log, MariaDB Query Log, and Audit Log, enable the SkySQL API by selecting the SkySQL (Using API) option from READ FILE FROM dropdown:
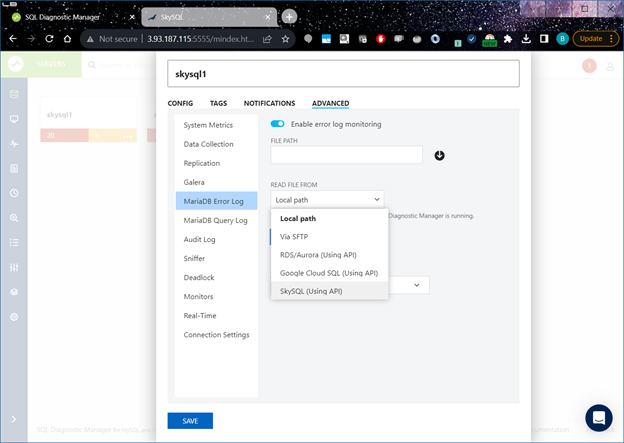
Type the Server Datasource ID and SKYSQL API Key from the first steps: