Page History
...

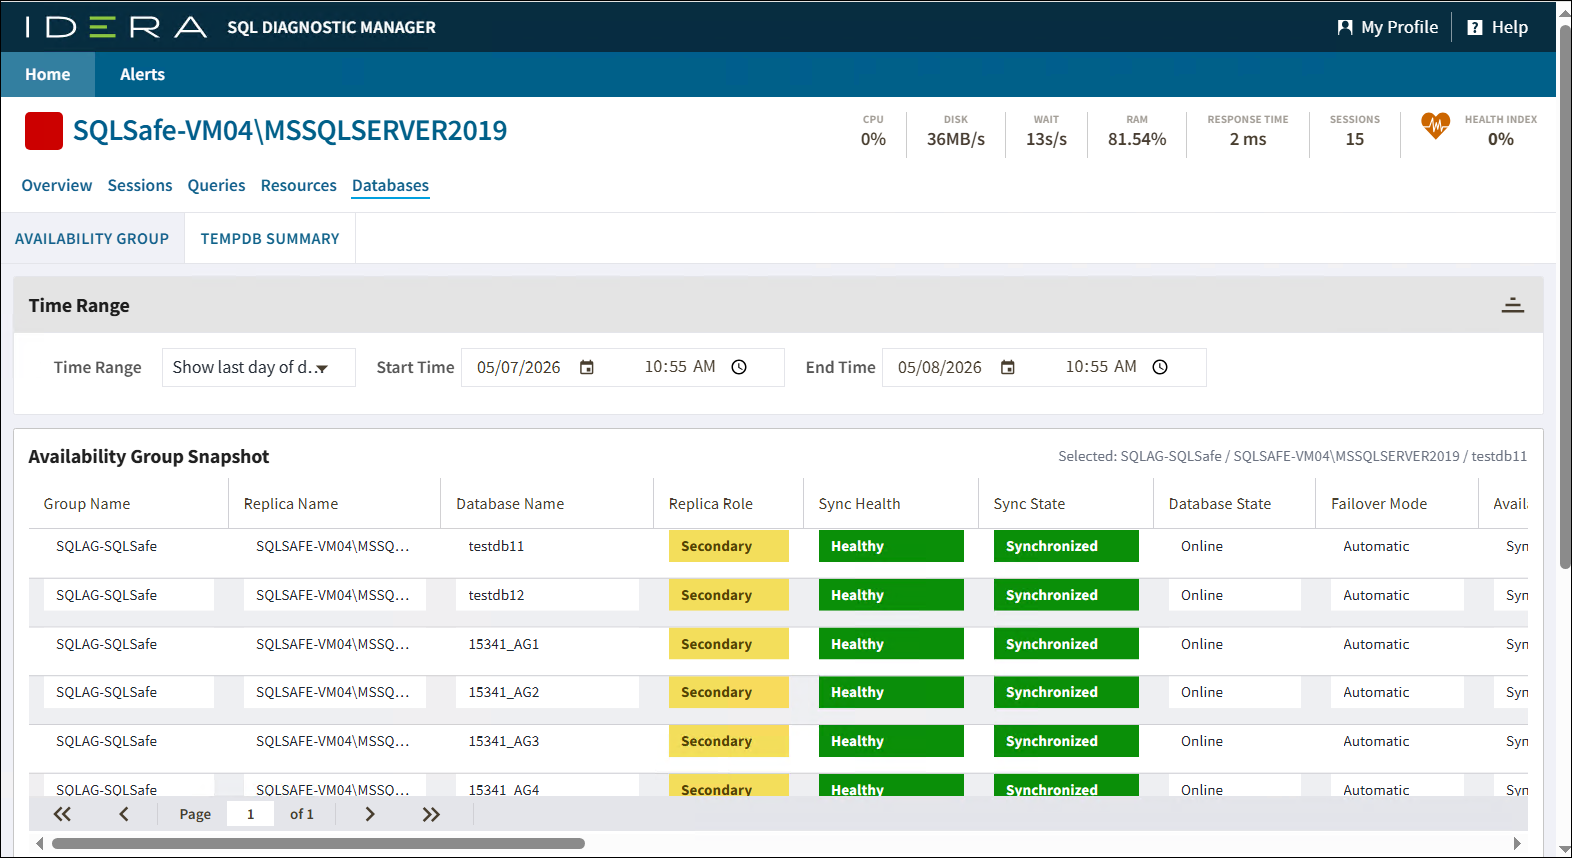
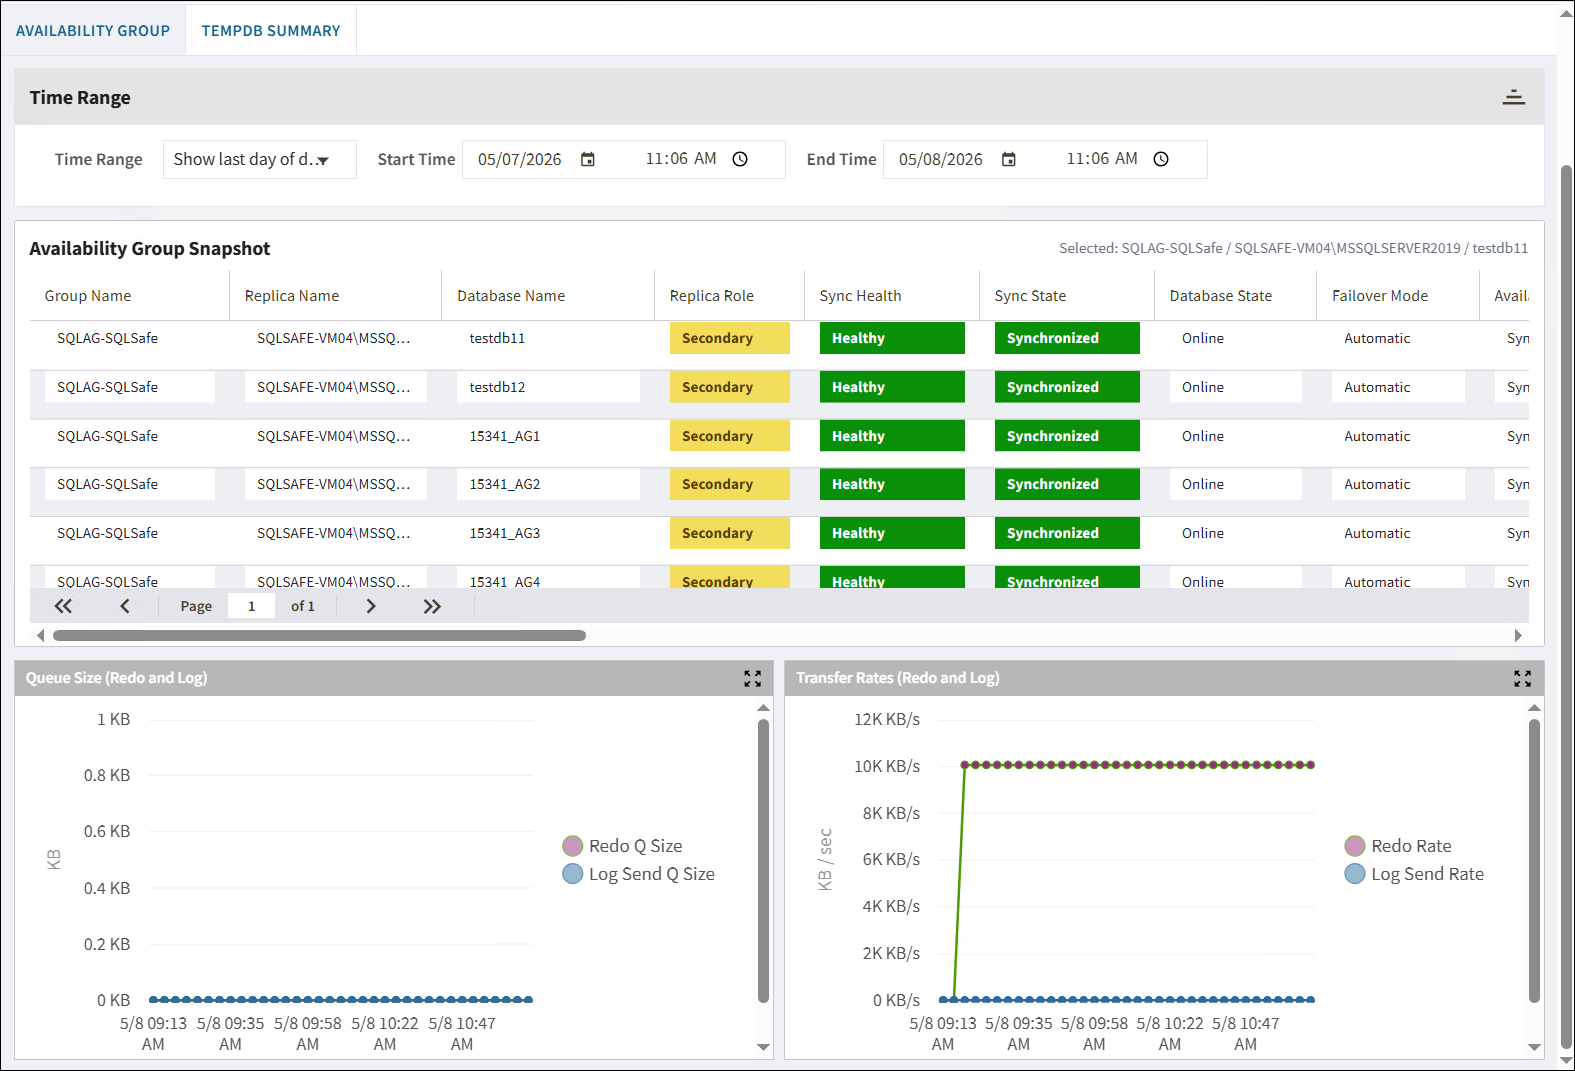
Anchor AvailabilityGroup AvailabilityGroup
Availability Group
| AvailabilityGroup | |
| AvailabilityGroup |
The Summary tab displays real-time charts that allow you to quickly view key diagnostic statistics for monitoring the resources for the selected SQL Server instance and computer on which it resides Availability Group tab allows you to monitor availability groups, availability databases, and availability replicas. For more information about using this view and fields, see the help topic for the desktop version at: Get the resource performance summary Monitor AlwaysOn Availability Groups.

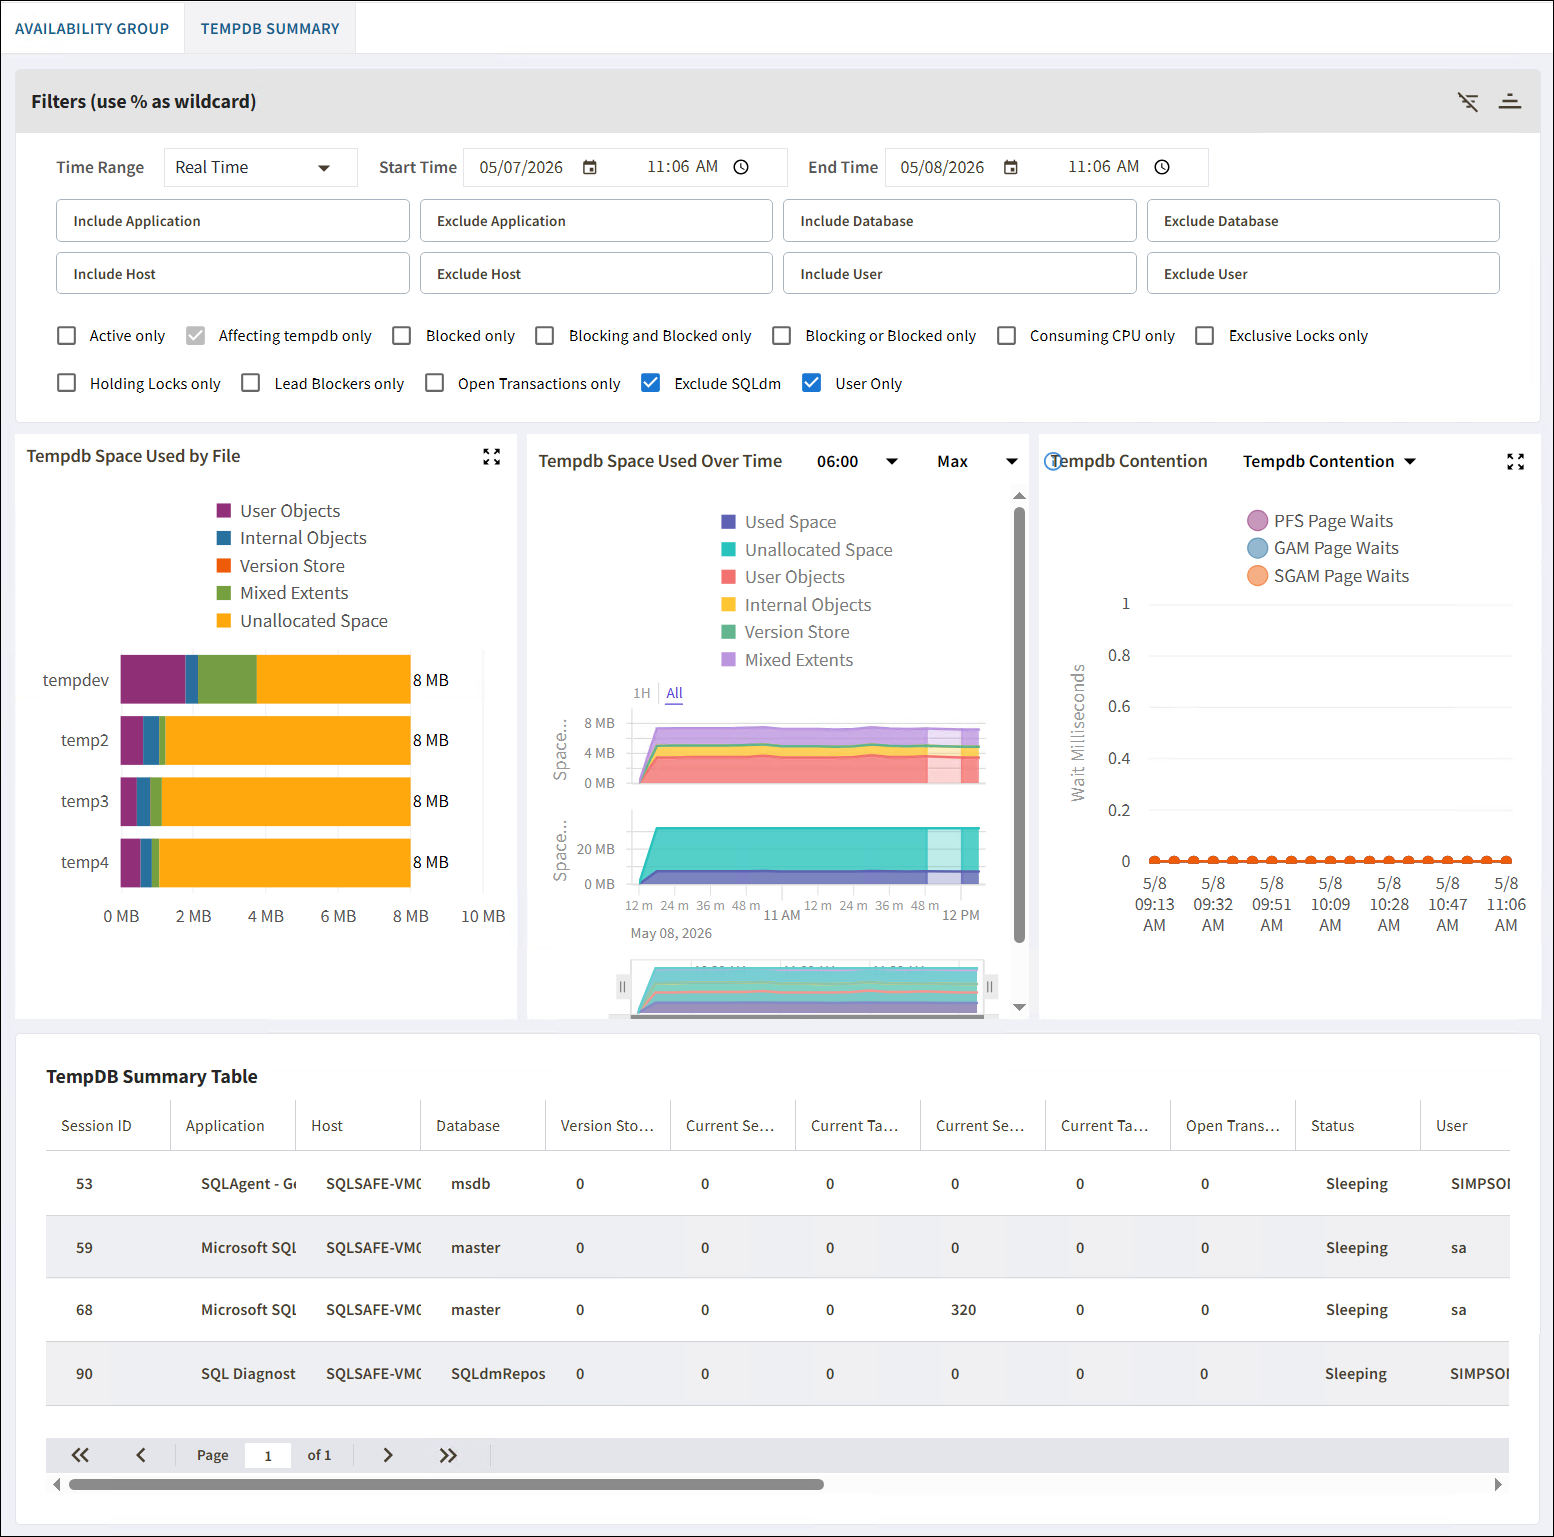
Anchor TempDBSummary TempDBSummary
TempDB Summary
| TempDBSummary | |
| TempDBSummary |
The CPU tab displays key CPU statistics that are updated according to your refresh interval. For TempDB Summary tab allows you to view the status of your tempdb database on the selected SQL Server instance. These charts include options for viewing your current capacity usage and recent trends of your files over time. For more information about using this view and fields, see the help topic for the desktop version at: Get CPU performance detailsthe tempdb status summary.