Page History
The Resources tab of the single instance dashboard contains several views such as CPU, Memory, Disk, and Server Waits. The Resources tab allows you to monitor the system resources on the computer hosting the SQL Server instance as well as what is used by SQL Server.
| Info | ||
|---|---|---|
| ||
You can launch SQL Workload Analysis from the SQLDM web console single instance view and its tabs. The icon Launch SWA located on the top-right side of the screen is available when your instance is registered in SQL Workload Analysis product. |
Resource bottlenecks are often the cause of SQL Server performance problems. These bottlenecks can result from poor database application design or point to other system processes using valuable resources needed by SQL Server.
...
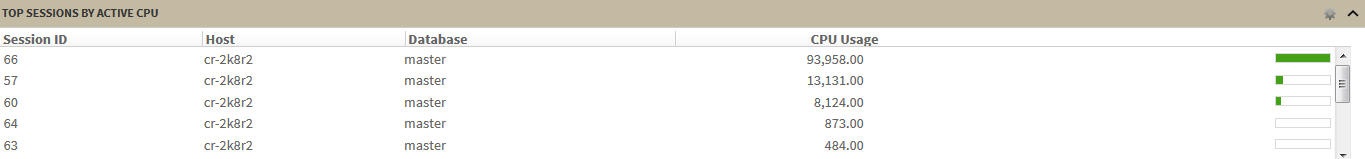
The Resources > CPU tab contains several charts and a Top sessions by active CPU widget (Click image to view full size).

Charts
Processor Time (%)
...
This widget allows you to view the top sessions of a selected SQL Server instance per CPU usage. You can configure this widget to display additional entries by clicking the gear icon or you can expand/contract by clicking ![]() .
.

Anchor Memview Memview
Memory view
| Memview | |
| Memview |
The Resources > Memory tab contains the following charts (Click image to view full size).

Charts
SQL Memory Usage (MB)
...
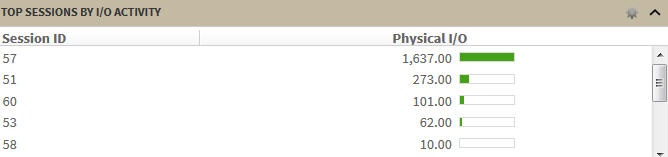
The Resources > Disk tab contains several charts and the Top sessions by I/O activity widget (Click image to view full size).

Charts
Disk Reads/Second Per Disk
...
This chart displays the number of read and write requests sent to the physical disk the SQL Server instance resides in. Read and write requests are classified in Checkpoint Writers, Read-Ahead Reads, Page Writes, Lazy Writer Writes, and Page Reads.
...
This widget allows you to view the top sessions of a selected SQL Server instance per I/O Activity. You can configure this widget to display additional entries by clicking the gear icon or you can expand/contract by clicking ![]() .
.

Anchor serverwaitsview serverwaitsview
Server Waits view
| serverwaitsview | |
| serverwaitsview |
The Resources > Server Waits tab contains a chart that display information on all waits occurring on your system and show the time different wait types occurred and the length of time (in milliseconds) it took for the waits to clear. Click image to view full size.


Wait categories in the drop-down menu
...
| Scroll pdf ignore |
|---|
SQL Diagnostic Manager identifies and resolves SQL Server performance problems before they happen. Learn more > > |