Page History
...
The Resources > CPU tab contains several charts and a Top sessions by active CPU widget (Click image to view full size).

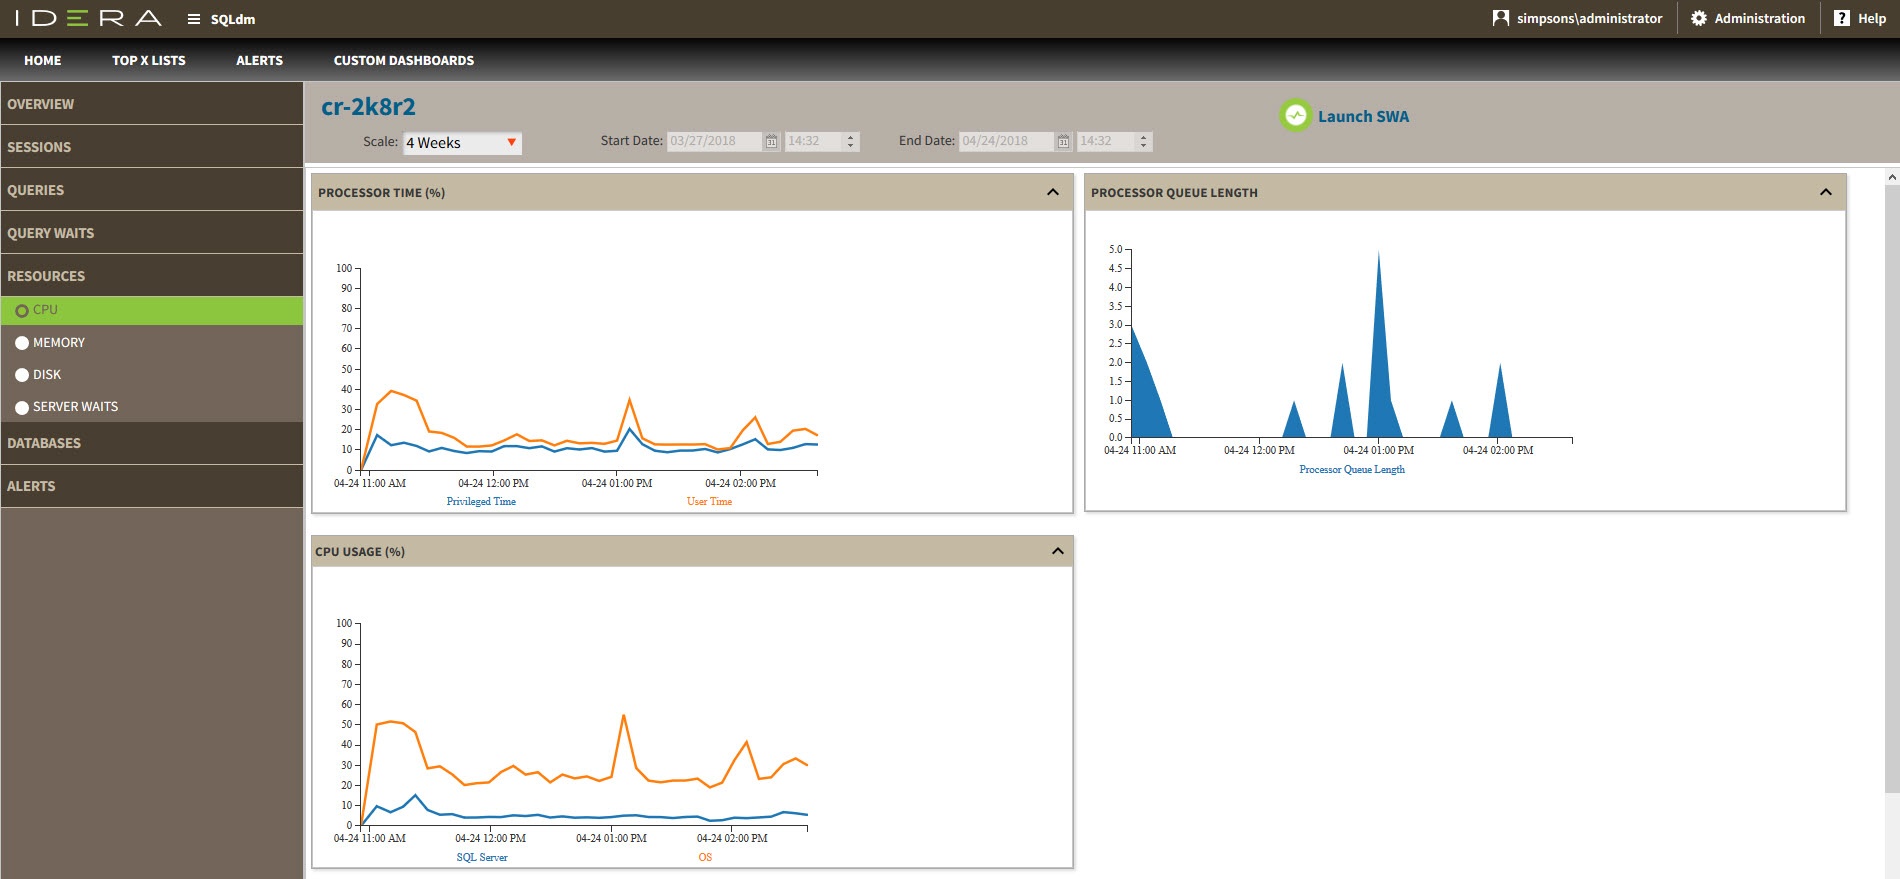
Charts
Processor Time (%)
...
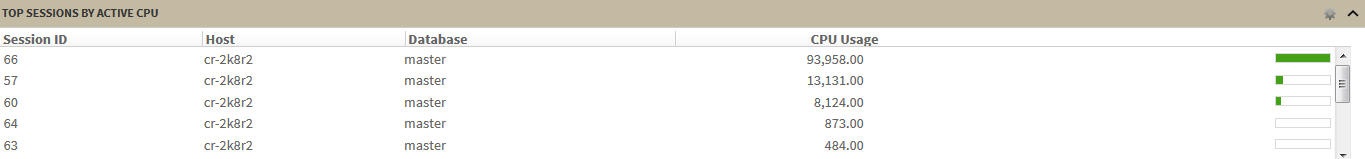
This widget allows you to view the top sessions of a selected SQL Server instance per CPU usage. You can configure this widget to display additional entries by clicking the gear icon or you can expand/contract by clicking ![]() .
.
Anchor Memview Memview
Memory view
| Memview | |
| Memview |
The Resources > Memory tab contains the following charts (Click image to view full size).


Charts
SQL Memory Usage (MB)
...
The Resources > Disk tab contains several charts and the Top sessions by I/O activity widget (Click image to view full size).

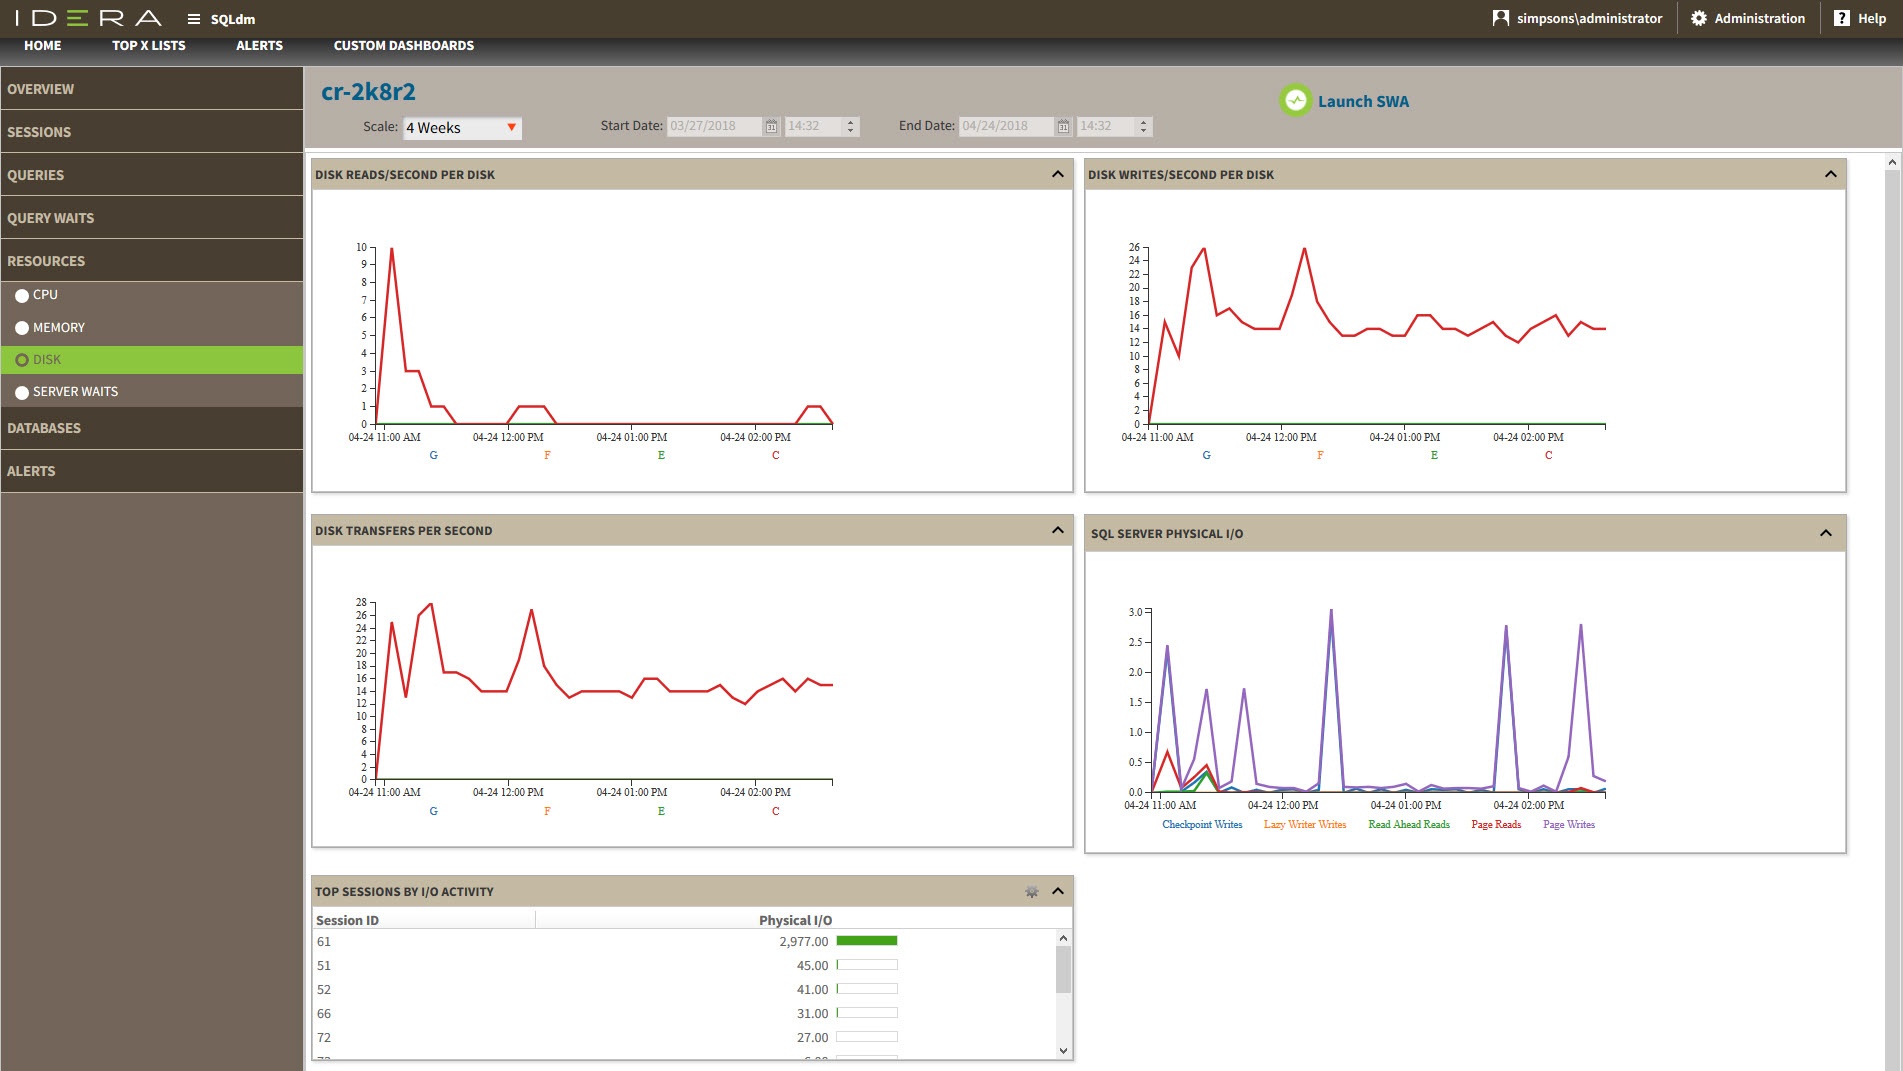
Charts
Disk Reads/Second Per Disk
...
The Resources > Server Waits tab contains a chart that display information on all waits occurring on your system and show the time different wait types occurred and the length of time (in milliseconds) it took for the waits to clear. Click image to view full size.

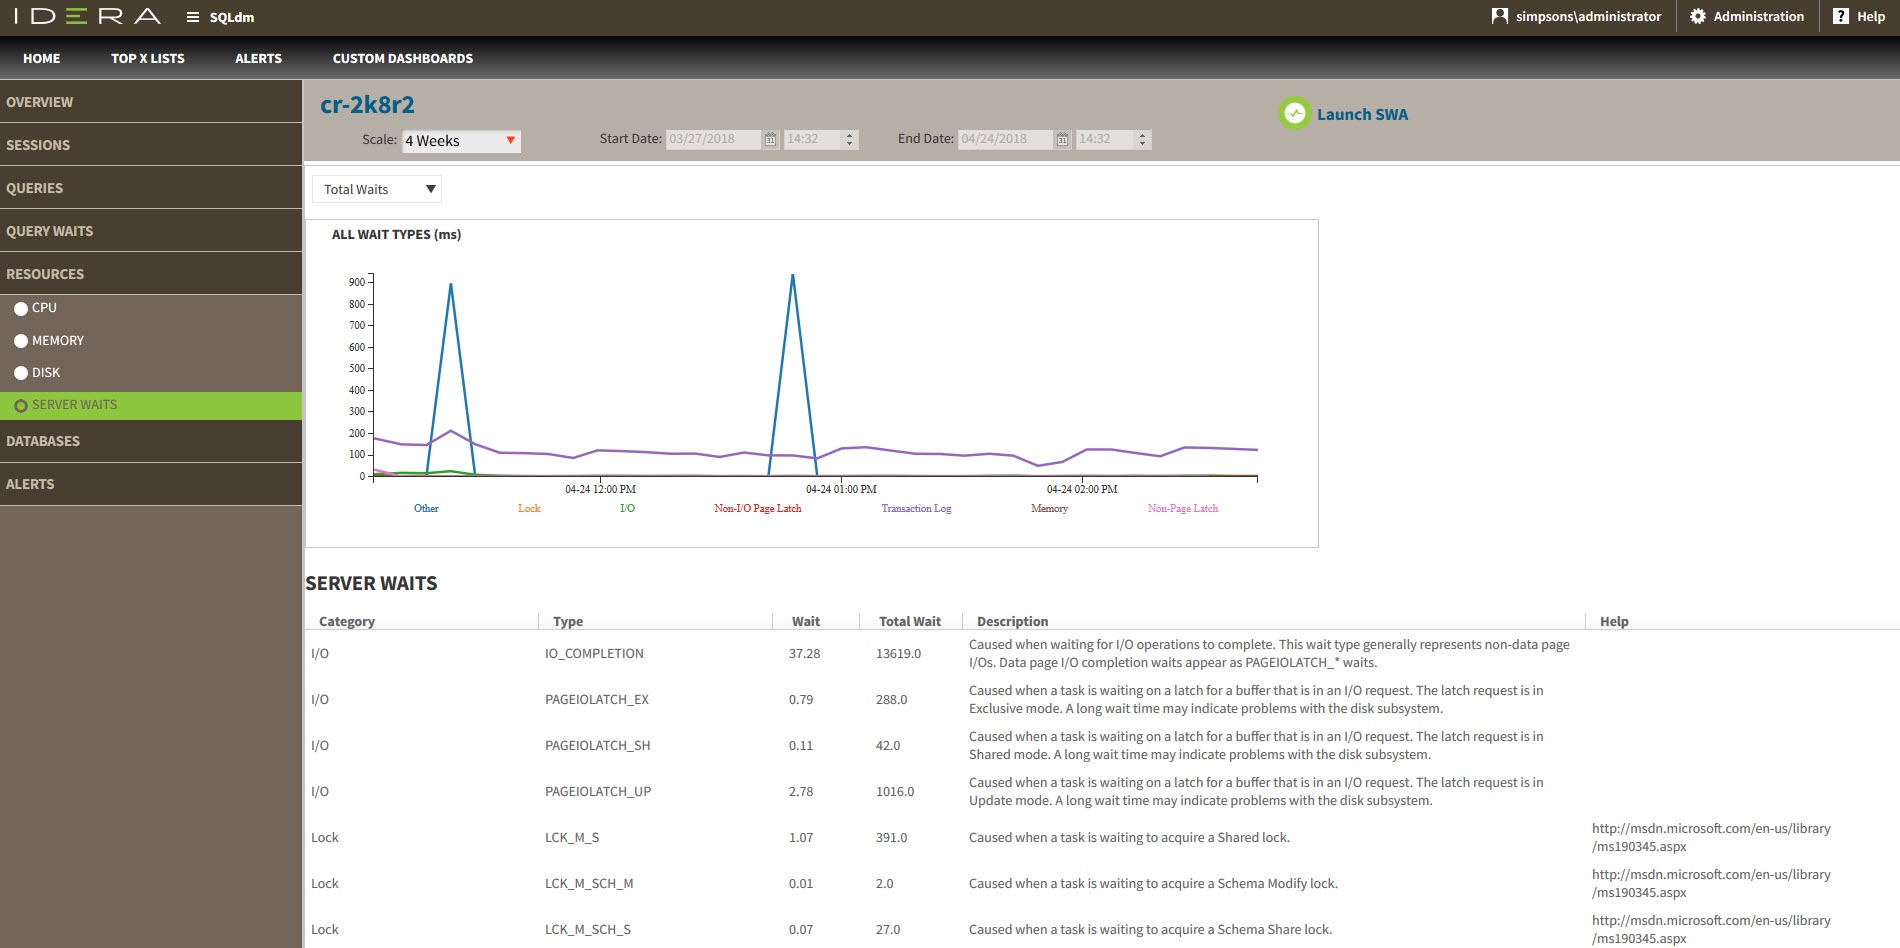
Wait categories in the drop-down menu
...