Versions Compared

Key

  • This line was added.
  • This line was removed.
  • Formatting was changed.

The Alerts Detail screen in the SQL Diagnostic Manager web console provides you with detailed statistics on your alerts.

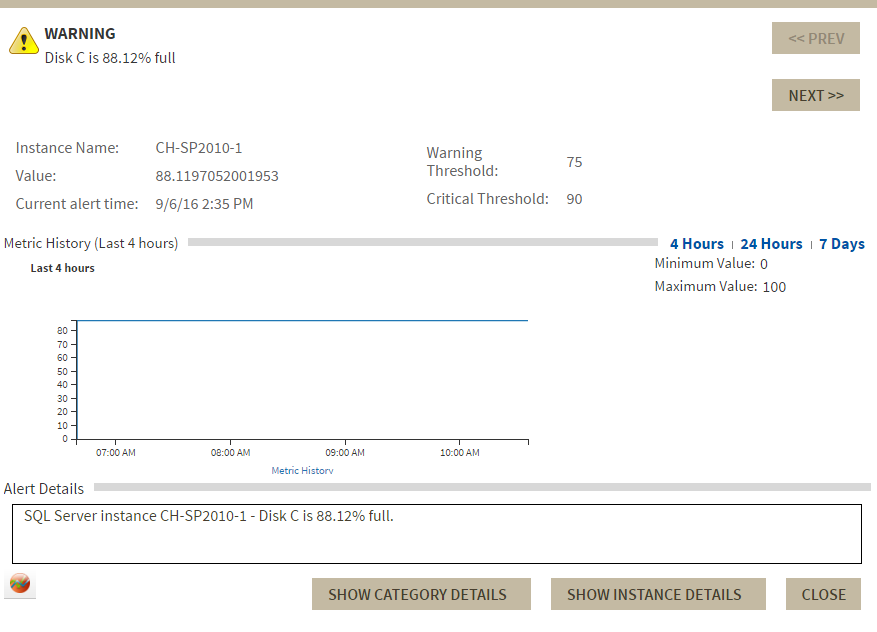
On the Alerts Detail screen you can find the following information:

...

SQL Diagnostic Manager provides several paths to access the Alerts Detail screen. The first access path is by clicking any row in the alerts roll up view of the Alerts tab. The second access path is by clicking over a category icon in the thumbnail sub-view that contains active alerts. It is also possible to access the Alerts Detail screen through the SQL Diagnostic Manager web console's home tab and the specific widgets it contains.


Legal
Scroll pdf ignore
SQL Diagnostics Manager for SQL Server performance monitoring, alerting, and diagnostics for SQL Server.
Newtabfooter
aliasIDERA
urlhttp://www.idera.com
Newtabfooter
aliasProducts
urlhttps://www.idera.com/productssolutions/sqlserver
Newtabfooter
aliasPurchase
urlhttps://www.idera.com/buynow/onlinestore
|
Newtabfooter
aliasSupport
urlhttps://idera.secure.force.com/
|
Newtabfooter
aliasCommunity
urlhttp://community.idera.com
|
Newtabfooter
aliasResources
urlhttp://www.idera.com/resourcecentral
|
Newtabfooter
aliasAbout Us
urlhttp://www.idera.com/about/aboutus
|
Newtabfooter
aliasLegal
urlhttps://www.idera.com/legal/termsofuse
SQL Diagnostic Manager identifies and resolves SQL Server performance problems before they happen. Learn more > >
IDERA WebsiteProductsPurchaseSupportCommunityAbout UsResources