Page History
...
| Info | ||
|---|---|---|
| ||
When the monitored instance it is registered in SQL Workload Analysis, the Launch SWA icon displays on the right side of the History Range Control. Click the Launch SWA icon to be redirected to SQL Workload Analysis. |


In the single instance dashboard, you can find the following sections:
- History Range Control
- Alert and Health Summary
- Prescriptive Analysis Summary
- Server properties
- Prescriptive Analysis
- Alert Timeline
- Alert Categories
- Charts
...
SQL Diagnostic Manager also includes a new History Range Control, located at the top of the Web Console and in the option History Browser in the Desktop Console, both can be modified and be designated a specific start time and date as well as current snapshot.

Anchor AHS AHS
Alert and Health Summary
| AHS | |
| AHS |
...
Anchor SP SP
Server Properties
| SP | |
| SP |
In this section view the most important characteristics of your monitored SQL Server instance.
...
| Tip |
|---|
Assign a friendly name to your instance that is meaningful to you and easy to identify. |
SQL Version
Indicates the current SQL Server SQL Server version including service pack and build information on this SQL Server SQL Server instance.
SQL Edition
Indicates the current SQL Server SQL Server edition, including Enterprise, Business Intelligence, or Standard, installed on this SQL Server SQL Server instance.
Running since
Indicates the timestamp associated with the most recent restart of this SQL Server SQL Server instance.
Clustered
Indicates whether this SQL Server SQL Server instance is part of a cluster. If it is part of a cluster, SQL Diagnostic Manager displays the name of the active node.
...
Indicates the total number of processors associated with this SQL Server SQL Server instance and how many of these processors are currently in use.
...
Indicates the name of the server hosting this SQL Server SQL Server instance.
Host Memory (GB)
Indicates the total amount of memory on the server hosting this SQL Server SQL Server instance.
Host OS
Indicates the current operating system on the server hosting this SQL Server SQL Server instance.
Data Size
Displays the data size of the server.
...
Displays the log size of the server.
| Anchor | ||||
|---|---|---|---|---|
|
The Prescriptive Analysis panel shows a summary of the performed Analyses, this panel shows the Date, the Duration, the Task Type, the number of recommendations, the Priority, and you can click the Show Recommendations to review the list of recommendations of each Analysis.
Anchor ATL ATL
Alert Timeline
| ATL | |
| ATL |
This graph shows a summary of the alert categories, CPU, Memory, I/O, Databases, Logs, Queries, Services, Sessions, Virtualization, Operational and Custom. This graph is color-coded depending on the status of the alerts inside each category.
...
- Click Edit, located next to the Alert Timeline graph.
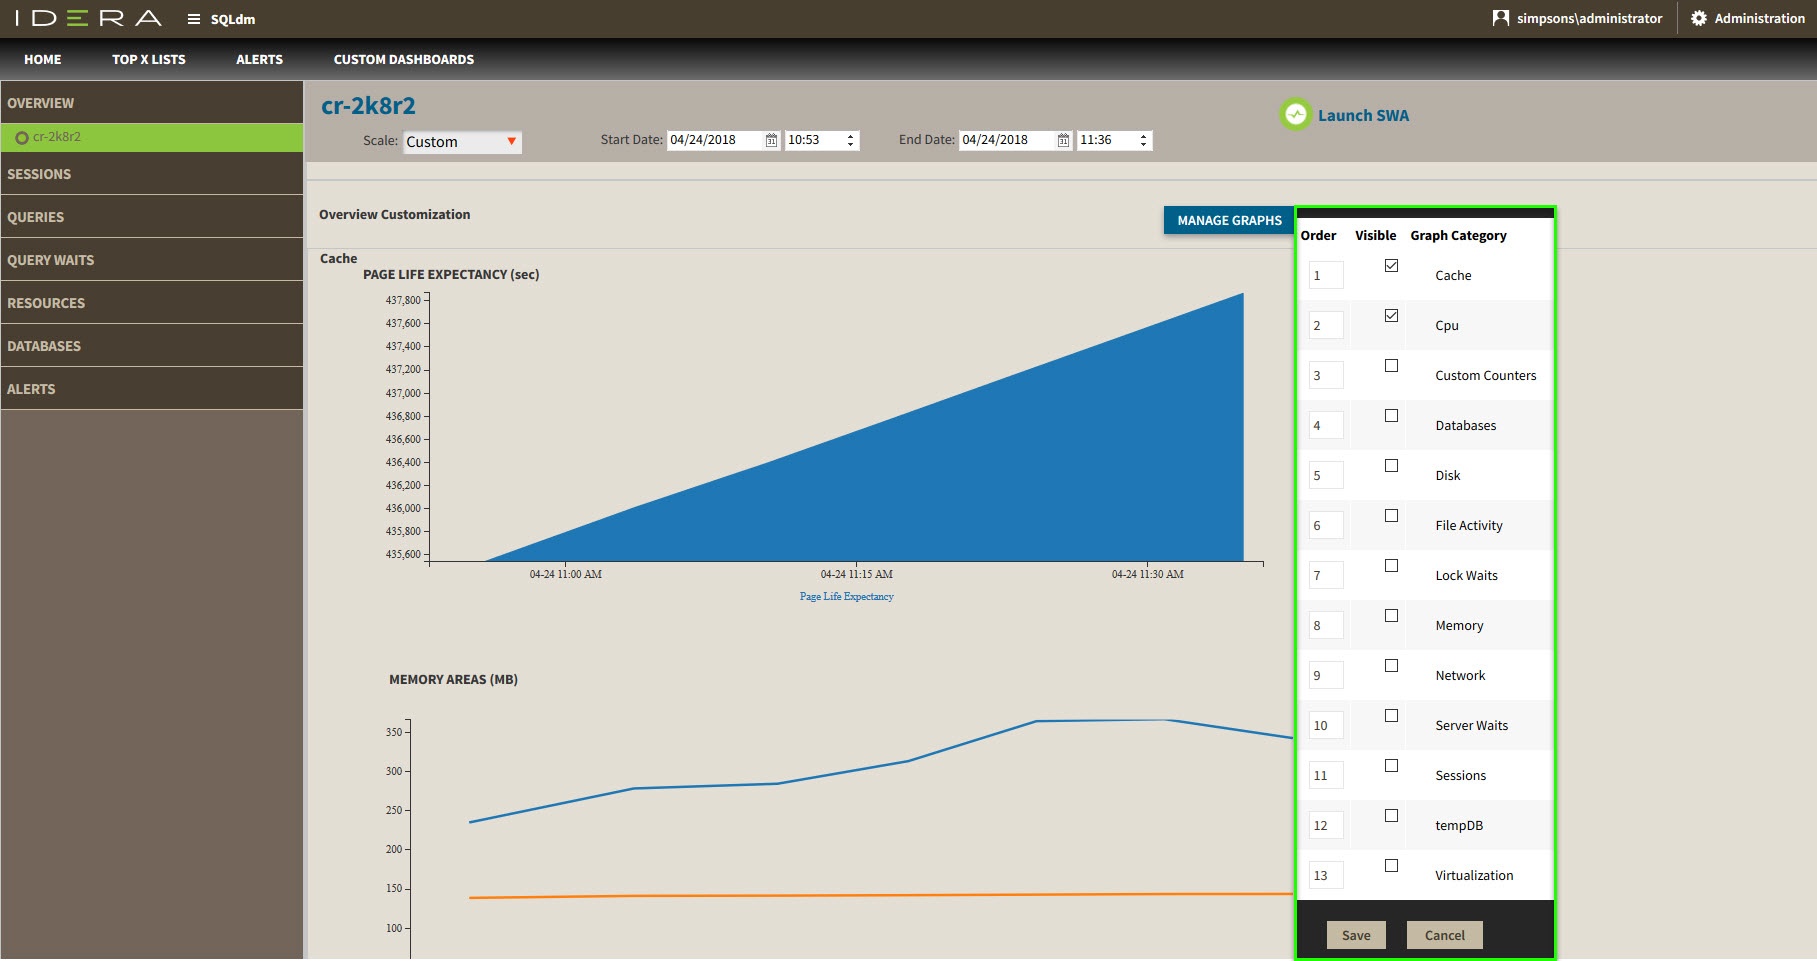
- Check or uncheck the checkboxes check boxes located under the Visible column.
- Or, reorganize the Order column with the listed numbers preferred.
- Click Save.
...
The single instance dashboard includes the option MANAGE GRAPHS. This option allows you to choose the following graphs to be displayed in the overview single instance view:
Cache
The Cache chart tracks the database and procedure processes using a buffer pool of memory on your monitored SQL Server SQL Server instance.
CPU
The CPU chart tracks the performance of the processor used by your monitored SQL Server.
...
The Custom Counters chart displays the statistics for a selected custom counter on a monitored SQL Server SQL Server instance.
Databases
The Databases chart tracks the performance of the databases on your monitored SQL Server.
...
The single instance dashboard contains the Overview, Sessions, Queries, Query Waits, Resources, Databases, and Alerts tabs where you can see metrics and information on these category views.

From these tabs you can:
- View your SQL Server sessions information.
- View your SQL Server queries information.
- View your SQL Server query waits information.
- View your SQL Server resources information.
- View your SQL Server databases information.
- View your SQL Server alerts.
...
SQL Diagnostic Manager provides several paths to access the single instance dashboard. The first access path is by clicking the appropriate monitored SQL Server instance in the list, thumbnail, or heatmap sub-views. The second access path is by clicking a specific instance from the Active Alerts panel, or the Most Critical Instances view in the main dashboard. It is also possible to access the single instance dashboard by clicking a specific instance or database in the Top servers by alert count, Top servers by response time, and Top databases by alerts widgets.