Page History
...
SQL statements are listed by the following parameters:
| Value | Notes |
|---|---|
| Statement | The name of the statement. |
| Executions | The number of times the statement was executed during the session. |
| Activity (%) | A graphical representation of the distribution of execution and wait time for the statement or statement component. |
| SQL ID | The SQL ID value of the statement. |
| Child Number | The child number in the database. |
| Parsing User ID | The ID of the user who parsed the statement. Plan Hash ValueThe execution value of the statement. |
| Plan Hash Value | The execution value of the statement. |
| Anchor | ||||
|---|---|---|---|---|
|
...
Events are listed by the following values:
| Value | Notes |
|---|---|
| Event Name | The name of the event. |
| Activity (%) | A graphical representation of the distribution of execution and wait time for the statement or statement component. |
| Anchor | ||||
|---|---|---|---|---|
|
...
The following parameters are displayed on the Procedures tab:
| Value | Description |
|---|---|
| Procedure Name | The name of the procedure that ran during the selected session. |
| Database Name | The name of the database where the procedure resides. |
| Procedure ID | The unique ID value of the file where the specified procedure resides. |
| Executions | The number of times the procedure was executed during the session. |
| DB Activity (%) | Use the color chart on the right-hand side of the Procedures tab to view the procedures load on the data source during the profiling session. |
Bind Variable Details
For Oracle data sources, profiling captures the bind variables and their attributes. Select an SQL statement in the Profiling Session and the details of the captured bind variables for that statement are displayed here.
...
The following parameters are displayed on the Bind Variable Details tab:
| Value | Description |
|---|---|
| SQL ID | SQL identifier used by the data source. |
| Child Number | A new child number is generated for the SQL ID of the query whenever the plan changes, for example the value of a bind variable is changed, and the query is executed again. |
| Position | The position of the variable within the SQL text. For example, given the query, select * from T1 where C1 = :a and C2 = :b and C3 = :c and C4 = :d, the position of a is 1, b is 2, c is 3 and d is 4. |
| Variable Name | The name of the variable. |
| Variable Type | The data type of the variable. |
| Variable Value | The value of the variable. |
| Anchor | ||||
|---|---|---|---|---|
|
In the Top Activities Section, selecting an entry on the Blocked Sessions tab displays information on sessions holding blocking locks in the Profiling Details view.
Blocked Sessions
The Blocked Sessions tab provides general information on blocked sessions and the details identifying the specific row locked.
...
Value | Notes |
|---|---|
User Name | The user name under which the blocking session was run. |
SID | The SID value of the blocking session. |
ROW_WAIT_OBJ# | Object ID of the table containing the row specified in ROW_WAIT_ROW#. |
ROW_WAIT_FILE# | Identifier of the datafile containing the row specified in ROW_WAIT_ROW#. |
ROW_WAIT_BLOCK# | Identifier of the block containing the row specified in ROW_WAIT_ROW#. |
ROW_WAIT_ROW# | The current row being locked. |
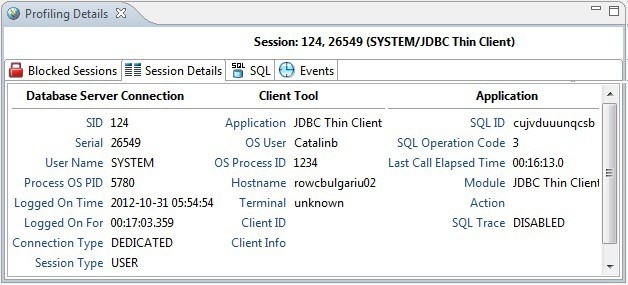
Session Details
The Session Details tab provides information on the server connection, client, and application associated with the blocking session.
SQL
The SQL tab displays information about the statements associated with the blocking session.
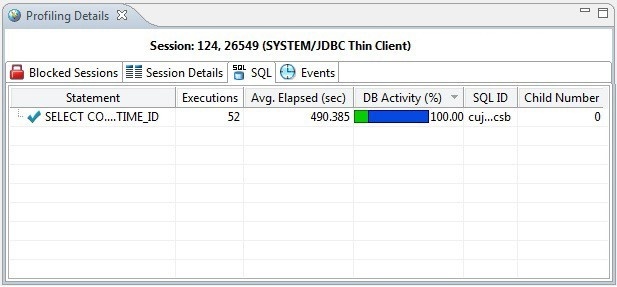
SQL statements are listed by the following parameters:
| Value | Notes |
|---|---|
| Statement |
...
| The name of the statement. |
| Executions |
...
| The number of times the statement was executed during the session. | |
| Activity (%) | A graphical representation of the distribution of execution and wait time |
...
| for the statement or statement component. |
| SQL |
...
| ID | The SQL ID value of the statement. |
| Child |
...
| Number | The child number in the database. |
Events
The Events tab provides details about the events that the blocking session is associated with.
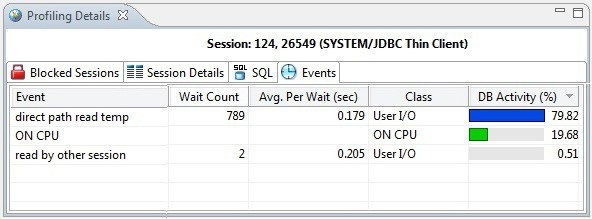
Events are listed by the following values:
| Value | Notes |
|---|---|
| Event |
...
| The name of the event. | |
| DB Activity (%) | A graphical representation of the distribution of execution and wait time for the statement or statement component. |
| Anchor | ||||
|---|---|---|---|---|
|
...
Viewing Details on the Events Tab
In the Top Activities Section, selecting a statement entry on the Event tab displays information in the Profiling Details view. The graph portion and details on the event category tabs on the new editor pertain only to the selected statement. Additionally, new tabs become available.
Selecting an event type entry on an event category tab opens a new profiling editor page. The graph portion and details on the Events tab and event category tabs on the new editor page pertain only to the selected wait event and to SQL statements that waited in that event. •
- SQL tab: Shows the statements involved in the selected event. For more information, see SQL.
...
- Sessions tab: Displays information about the sessions that the selected event is associated with. For more information, see Sessions.
...
- Procedures tab: Displays information about the procedures that ran during the selected event. For more information, see Procedures.
| Anchor | ||||
|---|---|---|---|---|
|
The SQL tab displays information about the SQL statements involved in the selected event.
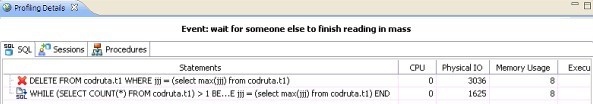
| Value | Notes |
|---|---|
| Statement |
...
| The name of the statement. |
| SQL |
...
| ID | The ID value of the SQL statement. |
| Child |
...
| Number | The child number in the database. |
| Parsing User |
...
| ID | The ID of the user who parsed the statement. |
| Plan Hash |
...
| Value | The execution value of the statement. |
| CPU |
...
| Cumulative CPU time for the process. (measured in "ticks", an arbitrary unit of time) |
| Physical |
...
| IO | Cumulative disk reads and writes for the process. (total count) |
...
| Memory Usage | Number of pages in the procedure cache that are currently allocated to this process. A negative number indicates that the process is freeing memory allocated by another process. |
...
| Executions | The number of times the statement was executed. |
| Activity (%) | A graphical representation of the distribution of execution and wait time for the statement or statement component. |
| Anchor | ||||
|---|---|---|---|---|
|
The Sessions tab displays the sessions and related information regarding those that were associated with the selected event.
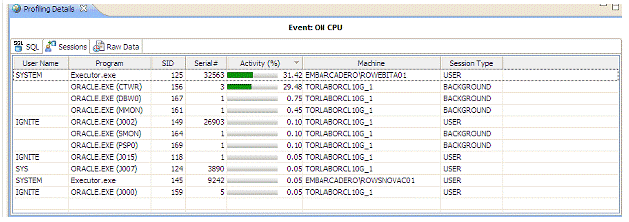
The following parameters are displayed on the Sessions tab:
| Value | Notes |
|---|---|
| User |
...
| Name | The user name under which the session was run. |
...
| Program | The name of the executable under which the session was run. |
...
| SID | The SID value of the session. |
| Serial |
...
| Number | The serial number of the machine from which the session executed. |
| Activity (%) | A graphical representation of the distribution of execution and wait time for the statement or statement component. |
| Machine |
...
| The machine name and network location of the machine from which the session executed. |
| Session |
...
| Type | The type of session. |
| Anchor | ||||
|---|---|---|---|---|
|
The Procedures tab displays the procedures and related information regarding those that were associated with the selected event.

The following parameters are displayed on the Procedures tab:
| Value | Notes |
|---|---|
| Procedure |
...
| Name | The name of the procedure that ran during the event. |
| Database |
...
| Name | The name of the database where the procedure resides. |
| Procedure |
...
| ID | The unique ID of the procedure. |
| Executions |
...
| The number of times the procedure ran during the event. | |
| DB Activity (%) | A graphical representation of the distribution of execution and wait time for the procedure. |
| Anchor | ||||
|---|---|---|---|---|
|
...
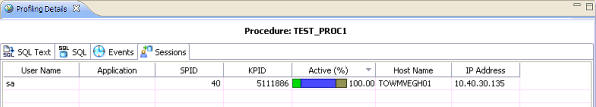
Viewing Details on the Procedures Tab
In the Top Activities Section, selecting a procedure entry on the Procedure tab displays information in the Profiling Details view. The graph portion and details on the procedure category tabs on the new editor pertain only to the selected procedure. Additionally, new tabs become available.
Selecting a procedure type entry on a procedure category tab opens a new profiling editor page. The graph portion and details on the Procedure tab and procedure category tabs on the new editor page pertain only to the selected procedure and to SQL statements that waited in that procedure. •
- The SQL Text tab shows the SQL of the procedure. For more information, see SQL Text.
...
- The SQL shows the statements involved in the procedure. For more information, see SQL.
...
- The Events displays the time and parameter information about the selected procedure. For more information, see Events.
...
- The Sessions displays information about the sessions that the selected procedure is associated with. For more information, see Sessions.
| Anchor | ||||
|---|---|---|---|---|
|
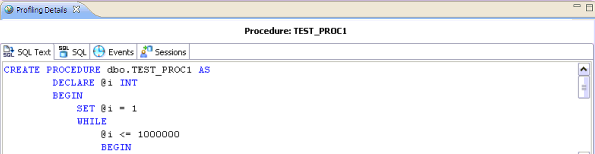
The SQL Text tab displays the full code of the procedure.
| Anchor | ||||
|---|---|---|---|---|
|
The SQL tab displays information about the SQL statements involved in the selected procedure.
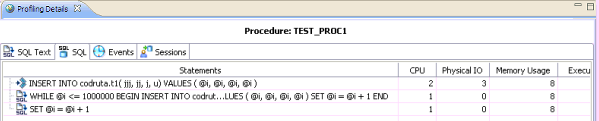
The SQL tab displays the following parameters about the statement:
| Value | Notes |
|---|---|
| Statement |
...
| The name of the statement. |
| SQL |
...
| ID | The ID value of the SQL statement. |
| Child |
...
| Number | The child number in the database. |
| Parsing User |
...
| ID | The ID of the user who parsed the statement. |
| Plan Hash |
...
| Value | The execution value of the statement. |
| CPU |
...
| Cumulative CPU time for the process. (measured in "ticks", an arbitrary unit of time) |
| Physical |
...
| IO | Cumulative disk reads and writes for the process. (total count) |
| Memory |
...
| Usage | Number of pages in the procedure cache that are currently allocated to this process. A negative number indicates that the process is freeing memory allocated by another process. |
| Executions |
...
| The number of times the statement was executed. | |
| Activity (%) | A graphical representation of the distribution of execution and wait time for the statement or statement component. |
| Anchor | ||||
|---|---|---|---|---|
|
The Events tab provides details about the events that the session is associated with.
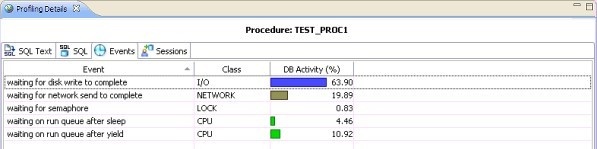
Events are listed by the following values:
| Value | Notes |
|---|---|
| Event |
...
| Name | The name of the event. |
| Class |
...
| The wait group the event in the selected procedure belongs to. | |
| Activity (%) | A graphical representation of the distribution of execution and wait time for the event. |
| Anchor | ||||
|---|---|---|---|---|
|
The Sessions tab displays the sessions and related information regarding those that were associated with the selected procedure.
The following parameters are displayed on the Sessions tab:
| Value | Notes |
|---|---|
| User |
...
| Name | The user name under which the session was run. |
...
| Program | The name of the executable under which the session was run. |
...
| SID | The SID value of the session. |
| Serial |
...
| Number | The serial number of the machine from which the session executed. |
| Activity (%) | A graphical representation of the distribution of execution and wait time for the statement or statement component. |
| Machine |
...
| The machine name and network location of the machine from which the session executed. |
| Session |
...
| Type | The type of session. |
For the Oracle Platform, you can kill a session by right-clicking the entry on the Sessions tab and choosing Kill Session. You can start a trace on a session by right-clicking the entry on the Sessions tab and choosing Trace. For more information, see Killing an Oracle Session and Tracing an Oracle Session.