Page History
...
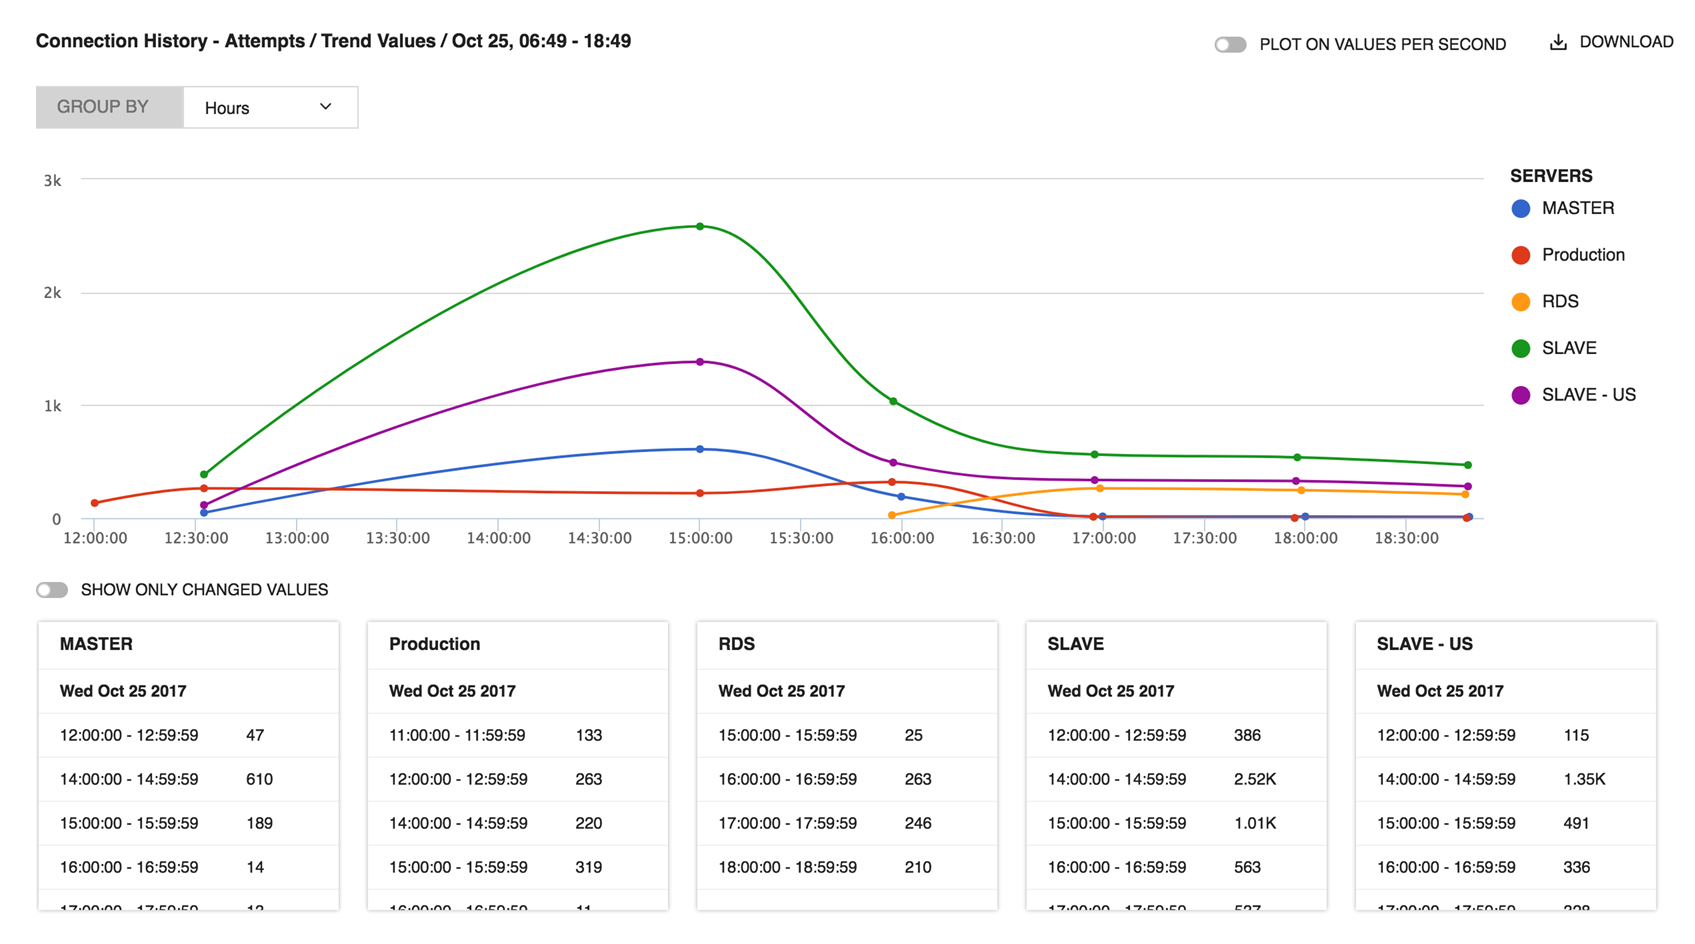
This is similar to the Current trend graph, the difference being that you can select any desired time-frame for which you want to see the graph for. You can choose the time-frame as History and then click the Trend Graph icon beside the counter name to see the graph. Along with the graph, it also shows the values of the monitor in the tabular form. Enable the option Show Only Changed Values to check when the monitor value was changed.
| Note |
|---|
This feature is available in SQL DM for MySQL Professional, Enterprise, and Ultimate. |
| Scroll pdf ignore |
|---|
IDERA Website | Products | Buy | Support | Community | About Us | Resources | Legal |