Page History
...
- Click the required application from the Applications list.
- In the Environmental map area, do one of the following:
- Click Alerts.
- Click a specific Tier, and from the pop-up menu select Alerts. The Alerts screen opens for the specified Tier tab.
The following figure shows an example of the information displayed when you open the Alerts tab for the first time.
Figure 2-1 Alerts Tab
Tab Selection
Alerts tree Precise bar
Metric Value area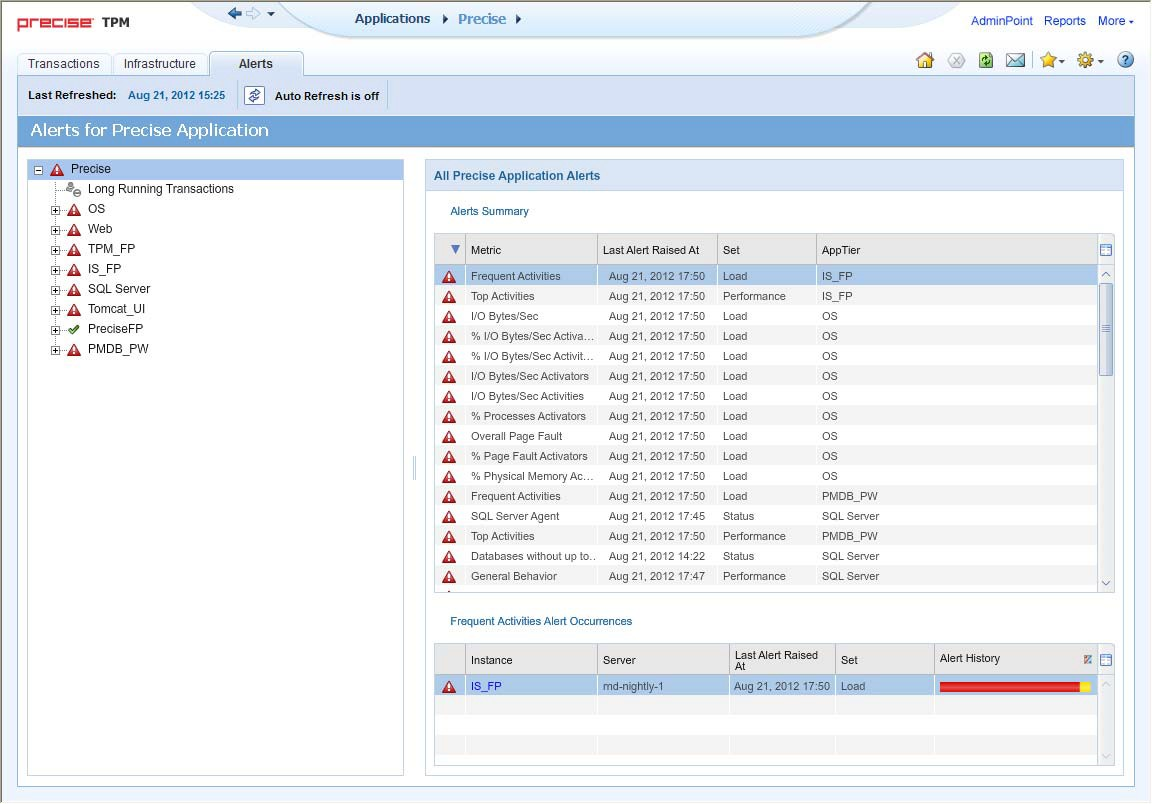
| Anchor | ||||
|---|---|---|---|---|
|
...
The right side of the main screen provides details of the alerts according to the element selected in the tree on the left side of the screen as follows:
- Application
...
- level. All application alerts listing:
- Alerts Summary
- Alert Occurrences
- AppTier level. AppTier
...
- alerts listing:
- Alerts Summary
- Alert Occurrences
- Instance
...
- level. Instance alerts listing all alert instances
- Metric
...
- level. Details of the instances of the alert including the following details:
- Metric description
- Alert current and historical occurrences
- Alert value
- What to do next
About the Tab heading
The Tab heading provides information about the refresh status. It contains the following:
...
The metric status legend contains icons that indicate the different alert statuses. The table below describes the status icons.
Table 2-2 Status icons
Icon Status Description
...
| Icon | Status | Description |
|---|---|---|
 | Key Metric | Indicates that the metric is defined as a key metric, which is a metric that monitors an important performance aspect. You can define a metric as a key metric through the Thresholds tab of the metric properties. |
...
 | Critical | Indicates |
...
| that the metric value exceeds the defined Critical threshold value. |
...
 | Near-Critical | Indicates that the metric value exceeds the defined Near-Critical threshold value. |
...
 | Normal | Indicates |
...
| that the metric value falls in the defined acceptable range. |
...
 | Down Time | Indicates that the metric is not sampled due to Down Time definition of the metric's technology or when the sampled instance is not available. You can set the Down Time definition through AdminPoint. See the Precise Administration Guide. |
...
 | Disabled | Indicates that the metric is disabled, and therefore it does not sample or generate alerts. A metric is disabled in case the related Precise product is not installed, or the metric properties are set to stop sampling. |
...
 | Not Sampled | Indicates |
...
| that the metric is not sampled since InformPoint was started, or errors occurred during the sampling process. |
See “About editing metric properties” on page 24.
...
Table 2-3 Alerts Summary - All Application Alerts
Column Description
...
| Column | Description |
|---|---|
| Alert | Indicates the highest alert severity level of the metric. |
| Metric |
...
| Indicates the metric name. |
| Last Alert Raised |
...
| At | Indicates the timestamp of the most recent sample. |
| Set |
...
| Indicates the metric set. |
...
| AppTier | Indicates the AppTier name of the metric. |
When you select an entry in the Alerts Summary table, details of the instance of the alert are displayed in the Metric Alert Occurrences table.
...
Table 2-4 Metric Alert Occurrences
Column Description
...
| Column | Description |
|---|---|
| Instance | Indicates the instance that is sampled by the metric. |
...
| Server | Indicates the server name where the instance (that is sampled by the metric) is running. |
| Last Alert Raised |
...
| At | Indicates the timestamp of the most recent sample. |
...
| Set | Indicates the metric set. |
| Alert |
...
| History | Appears only in the Metrics table. Indicates the number of normal, near-critical, and critical alerts that occurred during a pre-defined history period. The number of alerts does not include |
...
user-triggered samples (Resamples) from that history period. You can display the bar either in absolute values or relational values (percentage of the total alerts) by clicking the rectangle in the column header. You can modify the history period through the Settings dialog box. |
Application Level Metrics
...
AppTier in the Alerts tree
Table 2-5 AppTier Alerts
Column Description
...
| Column | Description |
|---|---|
| Alert | Indicates the highest alert severity level of the metric. |
...
| Metric | Indicates the metric name. |
| Last Alert Raised |
...
| At | Indicates the timestamp of the most recent sample. |
| Set |
...
| Indicates the metric set. |
When you select an entry in the AppTier Alerts table details of the instance of the alert are displayed in the Metric Alert Occurrences table.
...
Table 2-6 Metric Alert Occurrences
Column Description
...
| Column | Description |
|---|---|
| Instance | Indicates the instance that is sampled by the metric. |
...
| Server | Indicates the server name where the instance (that is sampled by the metric) is running. |
| Last Alert Raised |
...
| At | Indicates the timestamp of the most recent sample. |
...
| Set | Indicates the metric set. |
| Alert |
...
| History | Indicates the samples taken organized by time. |
| Anchor | ||||
|---|---|---|---|---|
|
The table below describes the details displayed in the Instance Alerts table that is displayed when you select an instance in the Alerts tree.
Table 2-7 Instance Alerts
Column Description
...
| Column | Description |
|---|---|
| Alert | Indicates the highest alert severity level of the metric. |
...
| Metric | Indicates the metric name. |
| Last Alert Raised |
...
| At | Indicates the timestamp of the most recent sample. |
...
| Set | Indicates the metric set. |
| Alert |
...
| History | Indicates the samples taken organized by time. |
When you select an entry in the Instance Alerts table details of the instance of the alert are displayed in the Metric Details table (see Metric Details).
| Anchor | ||||
|---|---|---|---|---|
|
The table below describes the details that displayed when you select a metric in the Alerts tree or in the Instance Alerts table (see Instance Alerts).
Table 2-8 Metric DetailsColumn Description
| Column | Description |
|---|---|
| Metric |
...
| Description | Detailed description of the metric. |
| Alert Current and Historical Occurrences |
...
| Bar graphic indicating current and historical occurrences. |
| Alert |
...
| Value | Displays a sample value for the alert. |
| What To Do |
...
| Next | Suggests various option as a next step. |
Precise. Performance intelligence from click to storage. Learn more > >
...