Page History
This section includes the following topics:
- About the Activity workspace
- How the Activity workspace is structured
- About the Activity workspace analysis tabs
- How the identify performance problems in the Tree View
| Anchor | ||||
|---|---|---|---|---|
|
The Precise for J2EE Activity workspace displays an execution tree of all monitored instances and various analysis tabs, enabling comprehensive and effective drilling down in the monitored instances and their invoked methods to locate specific performance issues and their underlying causes.
| Anchor | ||||
|---|---|---|---|---|
|
The Activity workspace is divided up into two main areas. The Main area (left pane) features an execution tree of all monitored instances. The Association area (right pane) features analysis tabs that provide specific information about the node selected in the execution tree in the left pane. The workspace heading displays the instance name, the server name, and what field the tree is sorted by.
Figure 3-1 Sample Activity Workspace
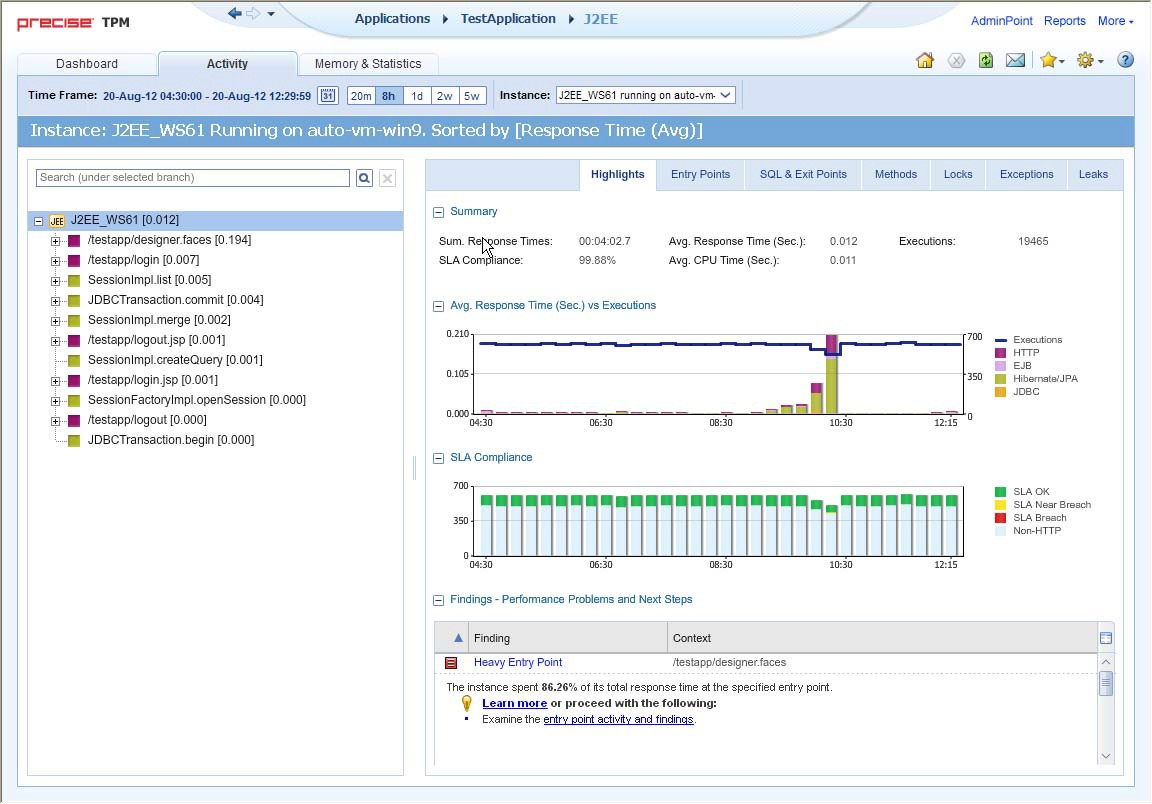
About the Main area
The Main area displays an execution tree of the monitored instance, broken down into the following node types:
...
Selecting a node displays information in context for that node and it’s underlying call path in the analysis tabs in the Association area. See “About the Association area” on page 25.
Viewing information in the Main area
By default, the execution tree in the Main area is launched displaying the top instance level (either a selected instance or all monitored instances) and the entry point level only. Navigate through the execution tree by clicking the ‘+’ sign next to the node name. This displays deeper layers of the tree, enabling you to view invoked methods and SQLs while maintaining the execution hierarchy.
| Info |
|---|
...
The degree to which you can drill down in an execution tree is defined by the filtering settings for your application. For more information, see Configuring Precise for J2EE in the Precise Administration Guide. |
The following table describes the information displayed in the execution tree.
Table 3-1 Information displayed in the execution tree
Field Description
...
| Field | Description |
|---|---|
| Icon | Displays an icon reflecting the node type. |
...
| Name | Displays the name of the selected node. Depending on the tree view settings selected, the name will be displayed either its short name, or its full execution context. |
| Selected |
...
| "Sorted by" value | Displays an aggregated value of the selected “sort by” option for the node’s entire underlying call tree. For example, the JDBC contribution to JVM response time will be an aggregation of all JDBC methods times of that JVM. |
To change the current tree view settings, see “Configuring Tree View Settings” on page 47.
...
Table 3-2 Information displayed in a node’s ToolTip
Field Description
...
| Field | Description |
|---|---|
| Type | Displays the node’s method type. |
| Context |
...
| Displays the full execution context of the selected node. |
| Selected |
...
| "Sorted by" type and |
...
| value | Displays the field by which the tree view is sorted by and the value for the selected node and its underlying call tree. |
The table below describes the “sort by” options available for the execution tree.
Table 3-3 Sort options for the execution tree
| Sorted |
|---|
...
| by | Description |
|---|---|
| Response Time (Avg) |
...
| Displays the average response time for each node and its underlying call path. The average response time is displayed in seconds. | |
| Response Time (Sum) |
...
| Displays the total response time for each node and its underlying call path. The summed response time is displayed in hours: minutes: seconds: milliseconds. | |
| Work Time (Avg) |
...
| Displays the average work time in seconds for each node. The average work time is displayed in seconds. | |
| Work Time (Sum) |
...
| Displays the summed work time in seconds for each node. The summed work time is displayed in hours: minutes: seconds: milliseconds. | |
| Executions |
...
| Displays the number of executions within each node. |
All of the sort options can be displayed in ascending or descending order. You can also select the maximum number of executions to display under each node, the maximum number of results to display, and whether to display the method’s long or short name.
...
When you right-click on an node in the execution tree, a popup menu is displayed. The following table describes the right-click menu options.
Searching within the execution tree
Above the execution tree in the Main area there is a search bar.
...
- Enter the desired value in the search bar.
- Click the search icon to the right of the search field. The heaviest results for the search value are emphasized in bold within the execution tree and their relevant call paths are opened.
| Info |
|---|
...
If the ‘Show short name only’ option is selected in the tree view settings dialog and the user enters the full name in the search value, the search will not return any results. |
About the Association area
The Association area displays a variety of analysis tabs, corresponding to the selected node in the execution tree. See “About the Activity workspace analysis tabs” on page 25.
| Anchor | ||||
|---|---|---|---|---|
|
The Activity workspace analysis tabs display indepth information about and in context of the node selected in the execution tree, shown within the tree in bold for referencing. While navigating through the analysis tabs, you can select different hyperlinked entities associated with the originally selected node. Selecting a hyperlinked node in an analysis tab will select that node within the execution tree, and all information displayed in the analysis tabs will be refreshed to correspond to the newly selected node.
...
Table 3-4 Analysis tabs available in the Precise for J2EE Activity workspace
| Tab |
|---|
...
| Name | Description | Displayed for | For more information |
|---|---|---|---|
| Highlights |
...
| Displays a comprehensive performance overview of the node selected in the execution tree. This view reveals performance problems of the entire call tree invoked under the selected node. |
...
| All entities. | See “The Highlights tab” on page 26. | |
| Load |
...
| Balance | Displays information for the selected node throughout the monitored application. |
...
All entities.
|
|
...
| See “About the Load Balance tab” on page 28. | ||
| Impact |
...
| Displays information regarding the selected node’s impact on the application. It displays general performance data for the selected node in the selected time frame and specific information regarding its contribution to all entry points and methods by which it is directly invoked. This view provides the user with a comprehensive overview of the specific method’s performance throughout the application. |
...
| See |
■ SQLs
...
| “About the Impact tab” on page 28. |
| Entry |
...
| Points | Displays and compares performance data of the entry points in the selected time frame. This view enables efficient identification of problematic entry points. |
...
| Instances/All instances |
...
| See “About the Entry Points tab” on page 30. |
| SQL & Exit |
...
| Points | Displays and compares performance data of the SQL and exit points in the selected time frame. This view enables efficient identification of problematic SQLs and exit points. |
...
| All entities except SQLs. |
...
| See “About the SQL & Exit Points tab” on page 31. |
...
| Methods | Displays information regarding all the methods and URI/iView invoked in the call tree under the selected node. The view provides a deeper look into a problematic node by showing comprehensive data for all invoked methods. |
...
| All entities except |
...
| SQLs. | See “About the Methods tab” on page 32. |
| Locks |
...
| Displays all methods in the call tree under the selected node that were locked at any point. This view provides an overview of all locked methods and enables the user to see locking trends. |
...
| All entities except |
...
| SQLs. | See “About the Locks tab” on page 33. |
| Exceptions |
...
| Displays data for exceptions thrown from the call tree under the selected node. This view pinpoints methods with a high exceptions rate. |
...
| All entities except |
...
| SQLs. | See “About the Exceptions tab” on page 34. |
...
| Leaks | Displays the object allocation data for the call tree under the selected node. |
...
| Instances/All |
...
| instances | See “About the Leaks tab” on page 35. |
The Highlights tab
The Highlights tab appears when any node type within the execution tree is selected, and displays a comprehensive performance overview of the selected node. The highlights tab provides information regarding performance trends for the selection’s underlying call path and displays performance findings to facilitate focused navigation to the root cause of a performance issue.
The Highlights tab includes the following components:
- Summary area
- Avg. Response Time (Sec) vs Executions overtime graph
- SLA Compliance overtime breakdown graph
- Findings table
- Avg. JDBC Time (Sec) overtime graph (for SQL only)
- SQL Text (for SQL only)
- Destinations table (for SQL only)
- Findings table
| Anchor | ||||
|---|---|---|---|---|
|
The summary area displays the following information for the selected node. The value displayed is the aggregated value for the selected node’s underlying call path (unless otherwise stated) in the selected time frame:
- SLA Compliance - displays . Displays the relative percentage of HTTP entry point service requests that approached or breached the defined SLA thresholds.
- Avg. Response Time (Sec) - displays . Displays the average response time for the selected node. The average response time is displayed in seconds.
- Executions - displays . Displays the number of executions within the selected node.
- Sum. Response Times - displays . Displays the total response time for the selected node. The summed response time is displayed in hours: minutes: seconds: milliseconds.
- Avg. CPU Time (Sec) - displays . Displays the average time that CPU was consumed for the selected node and its underlying call path.
- Method Type (when a method is selected only) - displays . Displays the method type.
- Impact on Entry Point (when a method or an SQL is selected only) - displays . Displays the percent value of the selected node’s summed response time out of its entry point’s summed response time.
- Max. Response Time (Sec) (when an SQL is selected only) - displays . Displays the peak response time detected in the selected time frame.
| Anchor | ||||
|---|---|---|---|---|
|
The Avg. Response Time (Sec) vs Executions overtime graph displays a bar for each time slice in the selected time frame that the selected node (or part of its underlying call path) was active. These bars display a breakdown of the invoked method types according to each method type’s average response time. The average response time for the entire time slice is compared to the number of executions in the time slice, displayed in linear format.
To the right of the table there is a legend detailing the method types displayed in the graph. Hovering over any point in the graph displays a ToolTip detailing the date and time of the selected time slice bar, the number of executions, and the average response times per method (in seconds) for that time slice.
| Anchor | ||||
|---|---|---|---|---|
|
The SLA Compliance overtime graph displays a bar for each time slice in the selected time frame that the selected node (or part of its underlying call path) was active. These bars display a breakdown of the SLA compliance of the invoked methods as follows:Note:
| Info |
|---|
SLA compliance is calculated for HTTP entry points only. |
- Green - the . The invoked method’s SLA is below the defined SLA threshold.
- Yellow - the . The invoked method’s SLA is approaching the defined SLA threshold.
- Red - the . The invoked method’s SLA exceeded the defined SLA threshold.
- Blue - top . Top level methods that do not have SLA thresholds defined for them (for example, EJB, JDBC, and so on).
These executions will appear as “Non-HTTP” executions.Note:
| Info |
|---|
Information for non-HTTP methods will not appear in the legend and in the graphs, but will appear in the ToolTip. |
| Anchor | ||||
|---|---|---|---|---|
|
The Avg. JDBC Time overtime graph displays a bar for each time slice in the time frame that the SQL was active. The average JDBC time (comprised of the JDBC time only as it is the lowest point in the execution tree and has no underlying branches) is compared to the number of executions in the time slice, displayed in linear format.
| Anchor | ||||
|---|---|---|---|---|
|
This area displays the entire name of the selected SQL.
| Anchor | ||||
|---|---|---|---|---|
|
Displays a table at all SQL destinations with details such as:
- DBMS
- DB Server
- DB Name
- Connection string details
| Anchor | ||||
|---|---|---|---|---|
|
The Findings table shows findings for the selected entity and its underlying call tree. Context names that are too long to display are automatically shortened using ellipses.
For more information regarding findings, see “How to identify performance problems” on page 49
About the Load Balance tab
The Load Balance tab displays the selected entity and compares its performance in all the contexts it was invoked by in the selected time frame. If “All instances” is selected in the execution tree, it will show the instances table (similar to the view provided in the Dashboard workspace).
| Info |
|---|
...
This tab is only displayed when “All Instances” is selected as the top level of the execution tree. When a specific instance is selected as the top level of the execution tree, this tab is not displayed. |
The Load Balance tab includes the following:
...
Stack Trace details appear in the expanded view that appears when hovering over each row’s complete path (Stack Trace).
| Anchor | ||||
|---|---|---|---|---|
|
You can identify a performance problem in Tree View by doing one or more of the following:
...