Page History
This section includes the following topics:
- About Precise for TPM tabs
- How most tabs are structured
- About drilling down in context
- About configuring your settings
- Tasks common to most tabs
| Anchor | ||||
|---|---|---|---|---|
|
Precise for TPM provides the user with a high level view of all monitored applications, and allows the user to focus on a specific application, the instances monitored in the installed tiers.
...
Table 1-1 Precise for TPM tabs
tab Description
...
| Tab | Description |
|---|---|
| Applications | Lets you quickly visualize the overall health and status of all instrumented application server instances. The Dashboard tab provides support for detailed views of individual application servers, as well as top-level summary views of multiple application servers. See About the Precise TPM Applications screen on page 12. |
| Transactions |
...
| Displays the end to end transactions of the monitored application. See About the Transactions tab on page 15. |
| Infrastructure |
...
Displays OS and virtualization. |
...
See About the Infrastructure tab on page 16. |
...
| Alerts | Lets you examine all generated alerts. See About the Alerts tab on page 16. |
You can easily switch between the different tabs using the tab Selection bar. See Switching to a different tab on page 9.
| Anchor | ||||
|---|---|---|---|---|
|
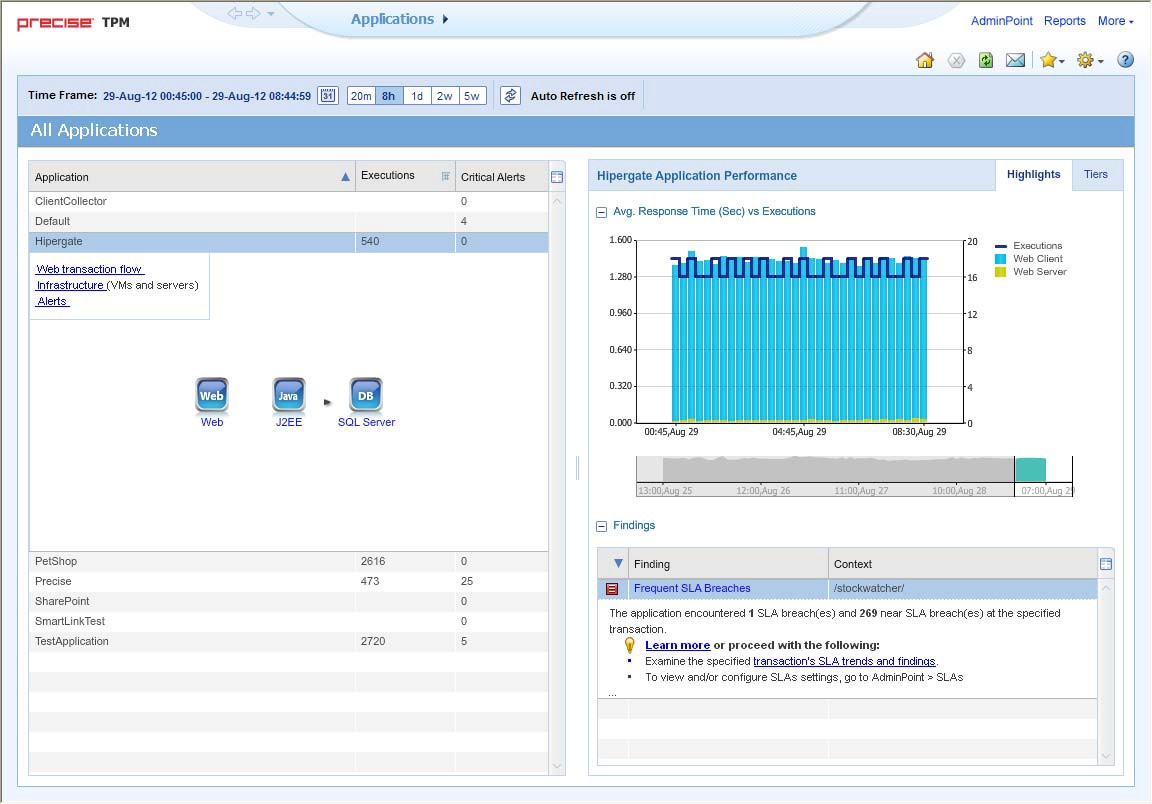
Though each tab is structured differently, most tabs consist of a Precise bar, tab selection bar, tab bar, and two areas (the Main area and the Association area). The Main area (left or top pane) features either a table or a tree view of all monitored applications, and the Association area (right or bottom pane) includes various tab specific tabs that display information in various formats, such as tables, graphs, or charts.
...
Figure 1-1 Sample Applications Screen
About the Precise bar
The Precise bar enables you to keep track of where you have been and provides various controls. The following table describes the function of each of the toolbar buttons.
Table 1-2 Precise bar functions
Icon Name Description
...
| Icon | Name | Description |
|---|---|---|
 | Back | During a work session, keeps track of where you have navigated to. The Back and History buttons enable you to navigate between previously visited views. The Back control displays your previous view. |
...
 | Forward | Enables you to navigate to the next view. This button is only enabled if you clicked Back or if you chose a history option. |
...
 | AdminPoint | Launches |
...
| Precise AdminPoint. |
...
 | Home | Navigates to the highest level entity, usually the instance or Tier (all instances). The time frame settings remain the same |
...
| . | ||
 | Stop | Stops |
...
| a request for information from the server. |
...
 | Refresh | Updates |
...
| the data currently displayed. |
...
 | Favorites | Enables you to add or remove favorites in your Favorites list. |
...
 | Send | Opens |
...
| a new email message in your email program with the link to the current application in context. |
...
 | Settings | Opens the General Settings, Transactions & Users Settings, and Time Frame Settings dialog boxes. |
...
 | Help | Opens |
...
| the online help in context. |
About the Main area
In most tabs, the left or top area is the Main area. This area displays an overview of all instances monitored by your Precise product. This information can be displayed in either graph, table, or tree format. The time frame that the information is displayed for can be seen in the tab toolbar, alongside the selected instance name (and drop-down menu) and auto-refresh status. The times displayed are the local times on the FocalPoint server where the page was generated.
About the Association area
The Association area displays indepth information for the entity selected in the Main area. Each tab has analysis tabs specific for that tab. As you navigate through Precise for TPM, the analysis tabs change to enable you to view specific information relevant to the selected tab and entity.
For example, the following analysis tabs are available in the Applications tab:
- Highlights
- Tiers
About the Findings area
For selected tabs in Precise products, the association area includes the Findings area, displaying problematic findings for the application. The findings feature is a high level tool, designed to provide the user with an overview of performance issues within the monitored application and enable quick and efficient navigation to the relevant tab for further analysis and handling. The displayed performance findings may indicate performance deteriorations as well as incorrect methods usage. Each finding appears as a row in the displayed table of findings. Hover the mouse indicator over the single-line displayed finding to expand the finding. When expanded, the finding details area provides important guidelines as to what may be the root cause for the reported problem, and what the recommended steps are to resolve this problem.
...
For more information, refer to Examining Findings on page 17.
| Anchor | ||||
|---|---|---|---|---|
|
The term ‘in-context’ means that you can display additional information on a selected item by drilling down to another tab or view. The filter settings you defined (for example, the selected time frame you chose) and the entity you selected are carried over to the other view or tab, to allow you to continue analyzing your subject from a different perspective. This concept takes on slightly different meanings depending upon where you are attempting to drill down in context from. In short, the information displayed when drilling down in context is always related to your original selection’s settings.
...
The tab heading displays the name of the currently selected entity on this screen. When you drill down to a new entity in the Association area, the tab heading changes to reflect the name of the newly selected entity.
| Anchor | ||||
|---|---|---|---|---|
|
The following settings allow you to control the appearance and behavior of the user interface. They can be configured from the Settings menu on the Precise bar:
...
Bar Graph ( ) This mode displays a solid bar graph for each entity in relative size to the entity with the highest value.
| Anchor | ||||
|---|---|---|---|---|
|
The following tasks are commonly performed in most tabs:
...