Page History
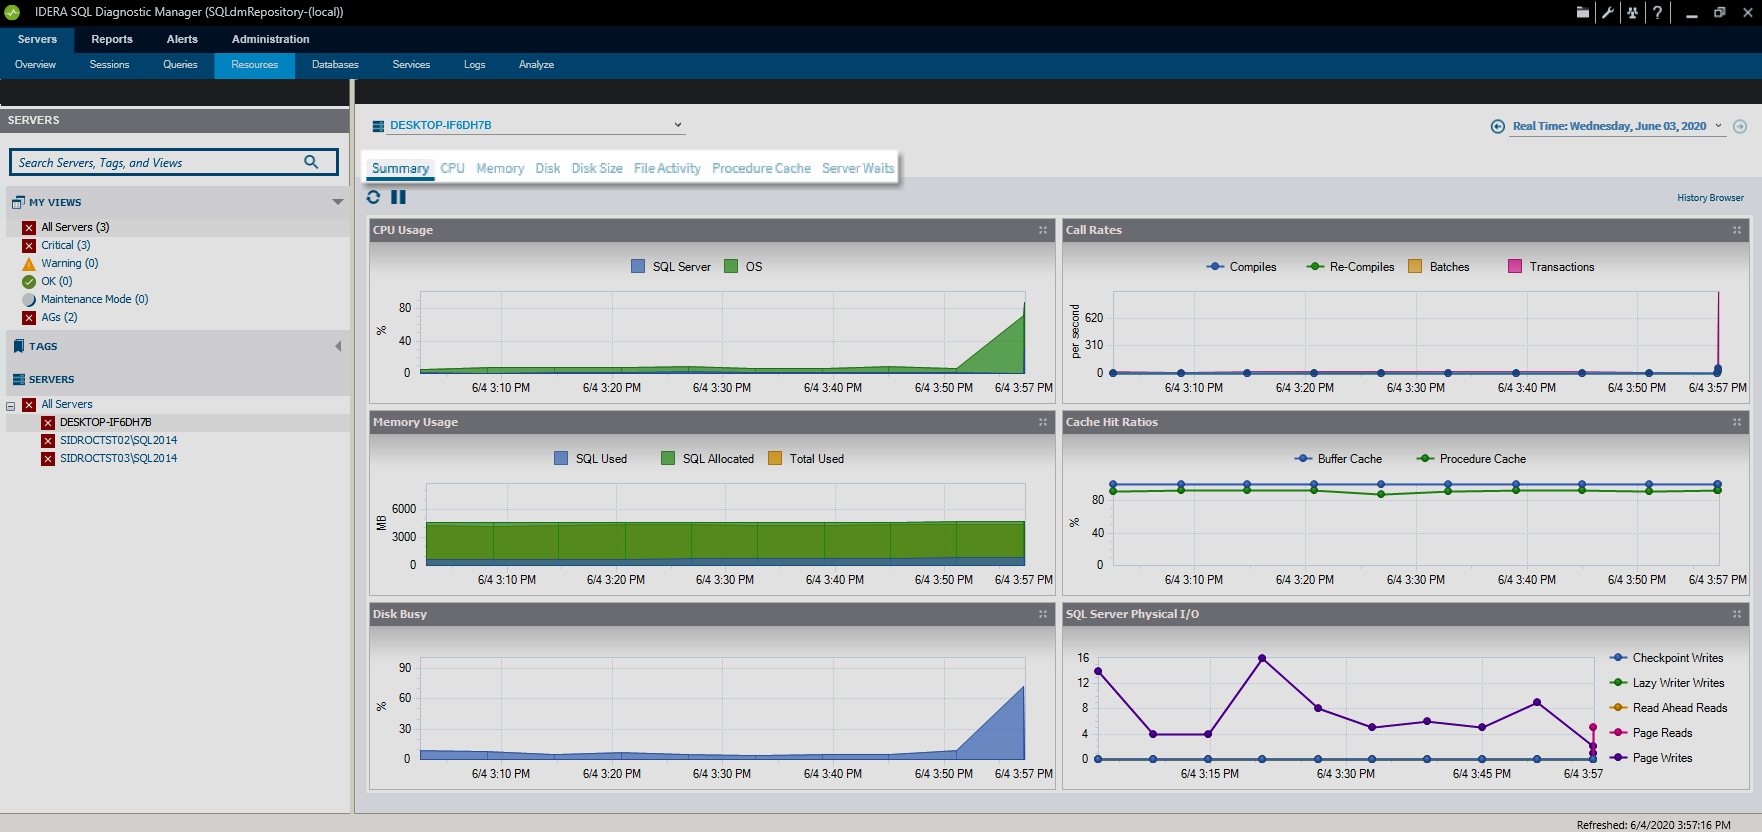
The Resources tab allows you to monitor the system resources on the computer hosting the SQL Server SQL Server instance as well as what used by SQL ServerSQL Server.
Resource bottlenecks are often the cause of SQL Server performance problems. These bottlenecks can result from poor database application design or point to other system processes using valuable resources needed by SQL Server.
Access the Resources tab
SQL Diagnostic Manager provides two paths to access the Resources tab. The first access path is Access this tab by clicking the appropriate monitored SQL Server instance, and then clicking SQL Diagnostic Manager and selecting the Resources tab. The second access path is by expanding the Servers tree, and then clicking Resources for the appropriate instance.
Alerts associated with the Resources tab
The following alerts are associated with the Resources tab:
Disk Reads / Seconds Per Disk
...
The number of disk transfers per second, per disk.
Disk Writes / Seconds Per Disk
...
The average number of both read and write requests queued for all the disks on the computer hosting the SQL Server instance.
OS Disk Time (Percent)
Indicates the percentage of elapsed time that all the disks were busy servicing read and write requests on the SQL Server computer.
OS Memory Usage (Percent)
Indicates the percentage of total memory used on the SQL Server computer.
OS Paging (Per Second)
Indicates the page fault rate for all processes on the SQL Server computer.
OS Privileged Time (Percent)
Indicates the percentage of CPU time used by all processes on the computer hosting the SQL Server instance, executed in Privileged mode.
OS Processor Queue Length
Is the number of ready threads in the processor queue on the computer hosting the SQL Server instance.
OS Processor Time (Percent)
Indicates the percentage of CPU time used by all processes on the computer hosting the SQL Server instance.
OS User Time (Percent)
Indicates the percentage of CPU time spent by all processes, on the computer hosting the SQL Server instance, executing in User mode.
Page Life Expectancy
The number of seconds a page stays in the buffer pool without references.
Procedure Cache Hit Ratio (Percent)
The ratio of procedure cache hits to procedure cache lookups.This indicates when an execution plan is reused from memory as opposed to compiled from disk.
SQL Server CPU Usage (Percent)
Indicates the percentage of the total CPU used by the SQL Server instance.
SQL Server Memory Usage (Percent)
...