Page History
| Note |
|---|
SQL Compliance Manager is ONLY compatible with IDERA Dashboard version 4.8.1 and with limited support. |
The IDERA SQL Inventory Manager list of managed instances displays all your environment's registered instances together with their status, SQL Server versions, editions, number and size of their databases, owners, locations and whether the instances are clustered.
You can click the headers of these columns to order your information; for example, click # of DBs to order all your instances according to the number of databases.
| Info | ||
|---|---|---|
| ||
Next to the instance name, you can find the following icons that represent the instance status:
|
| Tip | ||
|---|---|---|
| ||
You can set the number of instances you want SQL Inventory Manager to show per page. Go to the Display option at the bottom of the page, type the number you require, and then click Refresh. |
Available individual instance actions
When you select one instance, you can perform any of the following actions:
- View Details
- Refresh Data
- Edit Instance Properties
- Edit Tags
- Export
- Decommission
- Disable Monitoring
- Add SQL Server Instance
- Remove
Viewing instance details
You can access an instance details view by selecting the instance and clicking View Details on the action items bar or by clicking directly on the instance name. For more information about what information is available on the instance details view, refer to Viewing instance details.
Refresh Data
If you want to refresh the collected data for an instance, select the instance and click Refresh Data on the action items bar. You can also find this option by clicking the gear icon next to the respective instance. You can only perform this action for one instance at a time.
Edit instance properties
Select an instance and click Edit Properties on the action items bar. You can also find this option by clicking the gear icon next to the respective instance. On the properties dialog window you can change the owner, location, comments, and credentials. For more information go to Editing instances properties.
Edit Tags
By selecting an instance and clicking Edit Tags on the action items bar, SQL Inventory Manager opens a new dialog window where you can add new tags or change the currently assigned tags of the selected instance. You can also find this option by clicking the gear icon next to the respective instance. For more information about editing tags for a specific instance, go to Manage tags for a single instance.
More Actions
Under More Actions you can find additional options: Decommission, Disable Monitoring, Remove, and Add SQL Server instance.
Decommission
Using More Actions, select an instance and click Decommission on the action items bar to stop monitoring and alerting on that instance. You can also find this option by clicking the gear icon next to the respective instance. For more information about decommissioning an instance or database, see Decommissioned instances.
Disable Monitoring
If you want to disable the monitoring of an instance, select the instance, go to More Actions, and select Disable Monitoring. You can also find this option by clicking the gear icon next to the respective instance. For more information about disabling instances, click here.
Remove instance
If you no longer want to manage an instance, you can remove it by selecting the respective instance, going to More Actions on the action items bar, and selecting Remove. You can also find this option by clicking the gear icon next to the instance. SQL Inventory Manager displays all removed instances on the Ignored instances view. For more information about removing instances click here.
Add SQL Server instance
If you want to access the Add SQL Server instance wizard, go to More actions and select this option. The wizard opens and allows you to browse and register SQL Server instances.
Available bulk actions for multiple instances
Edit bulk properties
You can select several instances and change:
- Owner
- Location
- Credentials
- Tags
For example, if you have a new DBA, you can select all instances on this tab and click Edit Owner to change all instances owner at once.
You can also perform the following actions under the More Actions option:
- Decommission
- Disable monitoring
- Enable monitoring
- Remove
- Add SQL Server instances
To bulk edit several instances, select the instances you want to change and follow any of these paths:
- Click the option you want to perform on the action items bar: Refresh Data, Edit Owner, Edit Location, Edit Credentials, Edit Tags, Export, and More Actions including Decommission, Enable/Disable Monitoring, Remove, and Add SQL Server Instance.
- Or click the gear icon next to one of the selected instances. SQL Inventory Manager opens a dialog window that shows you on how many instances you are performing the changes.
| Info |
|---|
Take into account that Enable Monitoring will only be available if you have disabled instances. |
Exporting Instances view information
On the action items bar of the Managed Instances view, you can find the Export option which allows you to choose your preferred format for exporting the information available on this view. You can export as a PDF, XLS, or XML file. The filters you choose on this view will be taken into account for your exported reports.
Available filtering options
On the left side of the Instances view, you have options for filtering the instances that you want SQL Inventory Manager to display on your managed instances view. You can filter these instances by Tags, Owner, Location, and Version. These options will help you get a quick view of your required instances; for example, if you want to see your managed instances filtered by a specific Owner, just choose the respective option from the Owner filter.
Creating a useful filter to "weed out" unnecessary information takes time but is important when managing large environments. As a result, you may want to save that filter for future use. SQL Inventory Manager now allows you to save filters for use in the Explorer and Instances views. Simply create the filter, and then click Save as Explorer favorite or click Save as Instances favorite, depending on which view you are in when creating the filter. To use that filter, click Load Explorer favorite or click Load Instances favorite.
You can enable or disable the option Apply filter as it changes depending if you want to see the changes as you apply the filter, or if you prefer to select your filters first and see the results when you finish.
| Tip | ||
|---|---|---|
| ||
| SQL Inventory Manager displays the filters you select on the top section of your managed instances view under Filtered by. You can remove filters from this section too. |
| Info | ||
|---|---|---|
| ||
You can also access the Managed instances section by clicking Instances on the right sidebar of the overview. For more information, go to Viewing information on the SQL Inventory Manager Overview. |
Need more help? Search the IDERA Customer Support Portal.
Compliance Manager Alerts view allows you to view the current alerts and alert rules throughout your environment. An alert rule is a set of criteria that determines when an alert should be generated as the Collection Server processes SQL Server events collected from your audited instances. Use alert rules to detect events that occur on specific databases, users, or instances.
Available actions include:
Page through alerts and alert rules
Allows you to page through the list of alerts and rules. Use the previous and next arrows to navigate from page to page, up and down the list.
Filtering
Allows you to filter the listed alerts and rules by rule, rule type, server name, alert level, user email address, event log, and SNMP traps. Filtering includes a Save View feature that lets you select all of your filtering options, and then save the settings for future use. Click Load View to select a previously-saved view for use.
View By
Allows you to select whether Alerts or Alert Rules appear in this view.
Filtered By
Allows you to select the type of Alerts displayed in this view. You can view all Alerts, only your Event Alerts, only Data Alerts, or only Status Alerts based on this selection.
Export
Allows you to export the Activity Log and Change Log information to a CSV, PDF, or XML file.
Refresh
Allows you to update the Alert Rules list with current data.
Alerts view
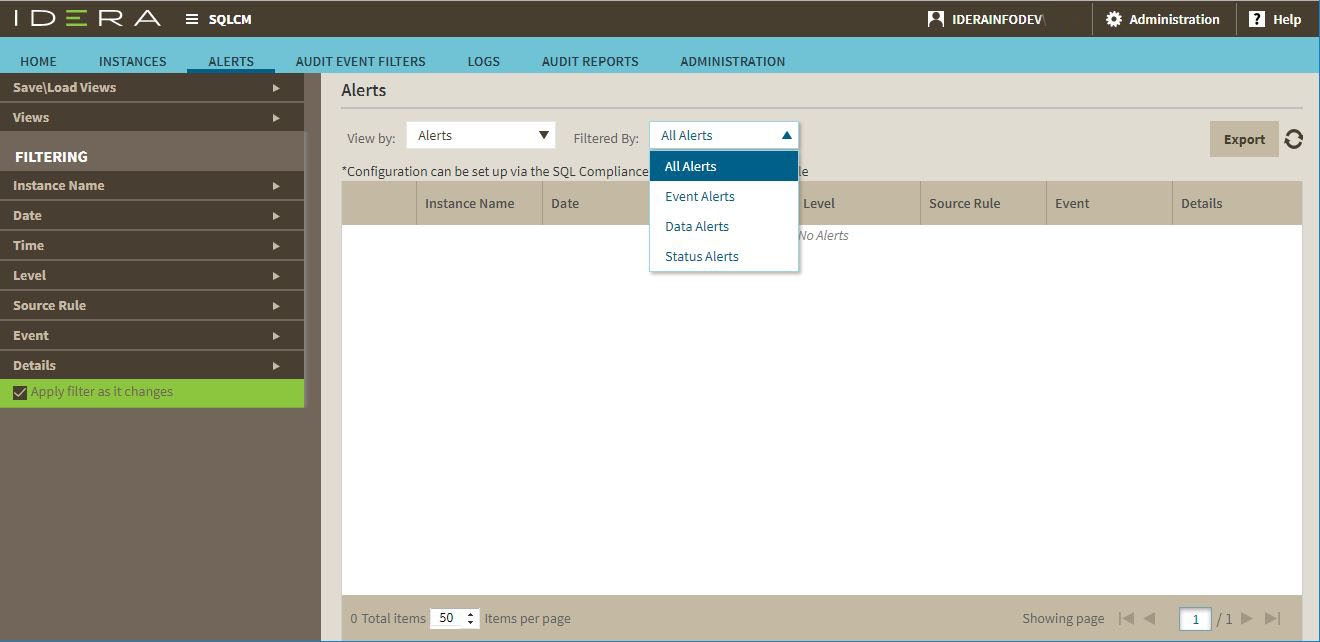
| Info |
|---|
Configurations can be set up via the SQL Compliance Manager Windows Console. |
Default columns
Instance name
Provides the name of the audited SQL Server instance where this event occurred.
Date
Provides the date when the alert was generated.
Time
Provides the time when the alert was generated.
Level
Indicates the type of alert, such as Severe or Low. Use the alert level to help you identify critical issues, sort alerts by severity, and understand the overall health of your environment. You can define the alert using the Edit Alert Rule wizard.
Source Rule
Provides the name of the alert rule that generated this alert.
Event
Provides the name of the audited event that triggered this alert.
Detail
Provides additional information about the alert.
Event Alerts view
The Event Alerts view, available from the Filtered By selection, allows you to view previously generated Event Alerts. An Event Alert is generated when the Collection Server processes a SQL Server event that matches the alert rule criteria. Use Event Alerts to identify and investigate suspicious activity on specific databases, users, or instances.
Data Alerts view
The Data Alerts view, available from the Filtered By selection, allows you to view previously generated Data Alerts. A Data Alert is generated when the Collection Server processes a SQL Server event that matches the alert rule criteria. Use Data Alerts to identify and investigate data manipulation on specific databases, tables, or columns.
| Info |
|---|
The Collection Server generates one alert per SELECT event, even though the query may have accessed multiple audited columns. |
Status Alerts view
The Status Alerts view, available from the Filtered By selection, allows you to view previously generated Status Alerts. A Status Alert is generated when the status of the specified product components matches the alert rule criteria. Use Status Alerts to identify and investigate possible issues with IDERA SQL Compliance Manager operations, such as deployed agents that may have stopped running.
Alert Rules view
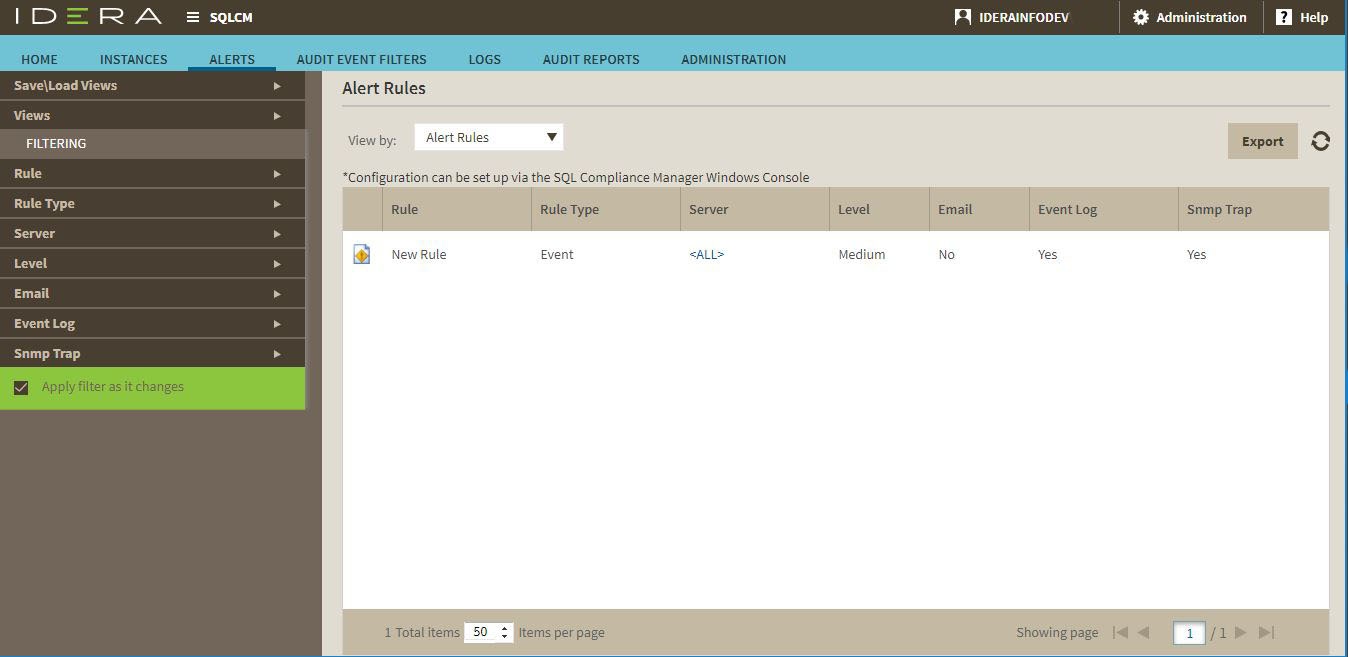
| Info |
|---|
Configurations can be set up via the SQL Compliance Manager Windows Console. |
Default columns
Rule
Provides the name you specified when you created each alert rule. By default, SQL Compliance Manager names each new rule New Rule.
Rule Type
Indicates whether this rule generates an Event Alert or a Status Alert.
Server
Provides the name of the registered SQL Server instance associated with this alert rule. By default, Event and Status Alerts apply to all registered SQL Server instances. For better focused Event Alerts, you can specify a different target SQL Server using the Edit Alert Rule wizard.
Level
Provides the alert level, such as High. Depending on the rule type, you can change the alert level using either the Edit Event Alert Rule or Edit Status Alert Rule wizard.
Indicates whether the alert rule criteria includes email notification. When email notification is configured, SQL Compliance Manager sends an alert message to the specified addresses. Depending on the rule type, you can set up email notification using either the Edit Event Alert Rule or Edit Status Alert Rule wizard.
Event Log
Indicates whether the alert rule criteria includes event log notification. When event log notification is configured, SQL Compliance Manager writes an alert message to the application event log. Depending on the rule type, you can set up event log notification using either the Edit Event Alert Rule or Edit Status Alert Rule wizard.
SNMP Trap
Indicates whether the alert rule criteria includes sending SNMP Trap messages to a specified network management console. When SNMP Trap is configured, SQL Compliance Manager sends an alert message to the specified network management console. Depending on the rule type, you can set up SNMP Trap notification using either the Edit Event Alert Rule or Edit Status Alert Rule wizard.
...