Page History
| Note |
|---|
SQL Compliance Manager is ONLY compatible with IDERA Dashboard version 4.8.1 and with limited support. |
The IDERA SQL Inventory Manager list of managed instances displays all your environment's registered instances together with their status, SQL Server versions, editions, number and size of their databases, owners, locations and whether the instances are clustered.
You can click the headers of these columns to order your information; for example, click # of DBs to order all your instances according to the number of databases.
| Info | ||
|---|---|---|
| ||
Next to the instance name, you can find the following icons that represent the instance status:
|
| Tip | ||
|---|---|---|
| ||
You can set the number of instances you want SQL Inventory Manager to show per page. Go to the Display option at the bottom of the page, type the number you require, and then click Refresh. |
Available individual instance actions
When you select one instance, you can perform any of the following actions:
- View Details
- Refresh Data
- Edit Instance Properties
- Edit Tags
- Export
- Decommission
- Disable Monitoring
- Add SQL Server Instance
- Remove
Viewing instance details
You can access an instance details view by selecting the instance and clicking View Details on the action items bar or by clicking directly on the instance name. For more information about what information is available on the instance details view, refer to Viewing instance details.
Refresh Data
If you want to refresh the collected data for an instance, select the instance and click Refresh Data on the action items bar. You can also find this option by clicking the gear icon next to the respective instance. You can only perform this action for one instance at a time.
Edit instance properties
Select an instance and click Edit Properties on the action items bar. You can also find this option by clicking the gear icon next to the respective instance. On the properties dialog window you can change the owner, location, comments, and credentials. For more information go to Editing instances properties.
Edit Tags
By selecting an instance and clicking Edit Tags on the action items bar, SQL Inventory Manager opens a new dialog window where you can add new tags or change the currently assigned tags of the selected instance. You can also find this option by clicking the gear icon next to the respective instance. For more information about editing tags for a specific instance, go to Manage tags for a single instance.
More Actions
Under More Actions you can find additional options: Decommission, Disable Monitoring, Remove, and Add SQL Server instance.
Decommission
Using More Actions, select an instance and click Decommission on the action items bar to stop monitoring and alerting on that instance. You can also find this option by clicking the gear icon next to the respective instance. For more information about decommissioning an instance or database, see Decommissioned instances.
Disable Monitoring
If you want to disable the monitoring of an instance, select the instance, go to More Actions, and select Disable Monitoring. You can also find this option by clicking the gear icon next to the respective instance. For more information about disabling instances, click here.
Remove instance
If you no longer want to manage an instance, you can remove it by selecting the respective instance, going to More Actions on the action items bar, and selecting Remove. You can also find this option by clicking the gear icon next to the instance. SQL Inventory Manager displays all removed instances on the Ignored instances view. For more information about removing instances click here.
Add SQL Server instance
If you want to access the Add SQL Server instance wizard, go to More actions and select this option. The wizard opens and allows you to browse and register SQL Server instances.
Available bulk actions for multiple instances
Edit bulk properties
You can select several instances and change:
- Owner
- Location
- Credentials
- Tags
For example, if you have a new DBA, you can select all instances on this tab and click Edit Owner to change all instances owner at once.
You can also perform the following actions under the More Actions option:
- Decommission
- Disable monitoring
- Enable monitoring
- Remove
- Add SQL Server instances
To bulk edit several instances, select the instances you want to change and follow any of these paths:
- Click the option you want to perform on the action items bar: Refresh Data, Edit Owner, Edit Location, Edit Credentials, Edit Tags, Export, and More Actions including Decommission, Enable/Disable Monitoring, Remove, and Add SQL Server Instance.
- Or click the gear icon next to one of the selected instances. SQL Inventory Manager opens a dialog window that shows you on how many instances you are performing the changes.
| Info |
|---|
Take into account that Enable Monitoring will only be available if you have disabled instances. |
Exporting Instances view information
On the action items bar of the Managed Instances view, you can find the Export option which allows you to choose your preferred format for exporting the information available on this view. You can export as a PDF, XLS, or XML file. The filters you choose on this view will be taken into account for your exported reports.
Available filtering options
On the left side of the Instances view, you have options for filtering the instances that you want SQL Inventory Manager to display on your managed instances view. You can filter these instances by Tags, Owner, Location, and Version. These options will help you get a quick view of your required instances; for example, if you want to see your managed instances filtered by a specific Owner, just choose the respective option from the Owner filter.
Creating a useful filter to "weed out" unnecessary information takes time but is important when managing large environments. As a result, you may want to save that filter for future use. SQL Inventory Manager now allows you to save filters for use in the Explorer and Instances views. Simply create the filter, and then click Save as Explorer favorite or click Save as Instances favorite, depending on which view you are in when creating the filter. To use that filter, click Load Explorer favorite or click Load Instances favorite.
You can enable or disable the option Apply filter as it changes depending if you want to see the changes as you apply the filter, or if you prefer to select your filters first and see the results when you finish.
| Tip | ||
|---|---|---|
| ||
| SQL Inventory Manager displays the filters you select on the top section of your managed instances view under Filtered by. You can remove filters from this section too. |
| Info | ||
|---|---|---|
| ||
You can also access the Managed instances section by clicking Instances on the right sidebar of the overview. For more information, go to Viewing information on the SQL Inventory Manager Overview. |
Need more help? Search the IDERA Customer Support Portal.
Compliance Manager Logs view lists events and alerts initiated by SQL Compliance Manager components, allowing you to monitor operations and diagnose issues within your environment. The Logs view consists of the Activity Log and Change Log areas, toggled by the option at the top of the page.
Available actions include:
Page through activities
Allows you to page through the list of activities. Use the previous and next arrows to navigate from page to page, up and down the list.
Filtering
Allows you to filter the listed activities by date, time, instance name, event, user name, and description. Filtering includes a Save View feature that lets you select all of your filtering options, and then save the settings for future use. Click Load View to select a previously-saved view for use.
Enable Groups
Allows you to group activities by a specific property, such as the computers on which the activities occurred or the times the activities occurred. Enable groups when you want to sort the activities or focus on a particular activity attribute.
Export
Allows you to export the Activity Log and Change Log information to a CSV, PDF, or XML file.
Refresh
Allows you to update the activity list with current data.
For more information about the Activity Log and Change Log tabs in the SQL Compliance Manager Monitoring Console, see Activity Log tab and Change Log tab.
Activity Log view
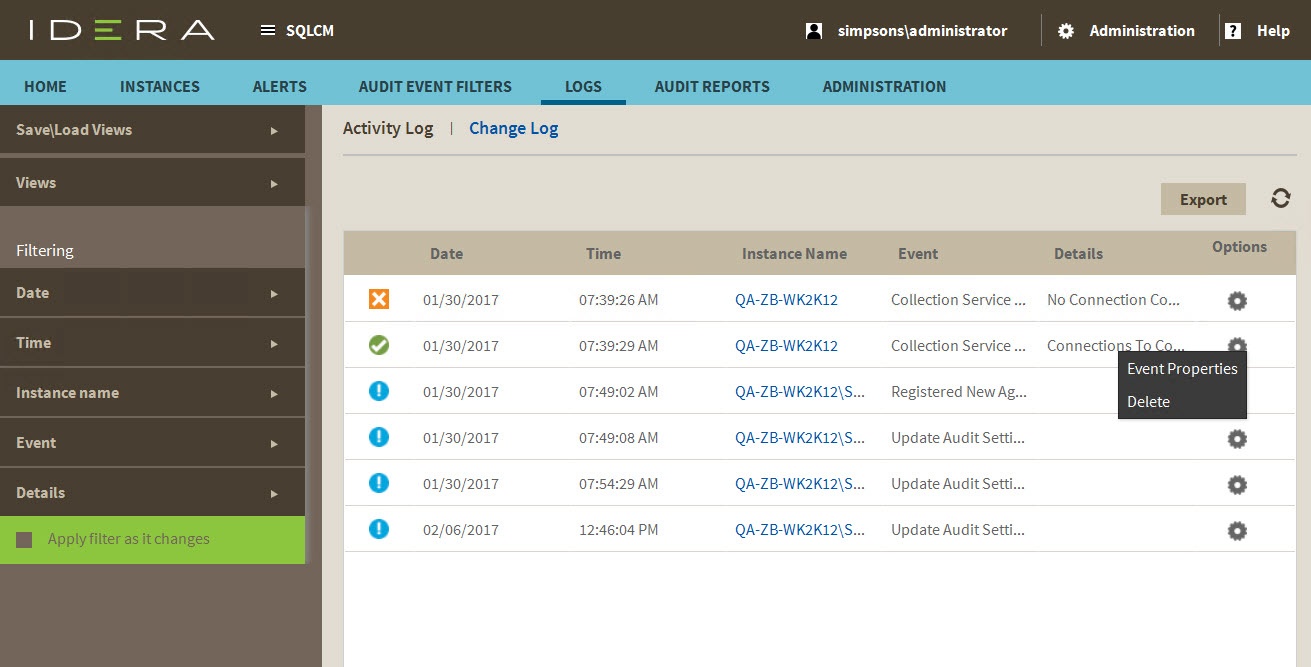
The Activity Log view displays a list of activity and system alerts across all registered instances. SQL Compliance Manager generates the following types of system alerts:
| System Alert | Caused by ... | Resolves when ... |
|---|---|---|
| Agent Configuration Error | Error saving the SQL Compliance Manager Agent configuration file (.bin) Error loading the new configuration | File is successfully saved SQL Compliance Manager Agent configuration is successfully updated |
| Collection Service Connection Error | Collection Server is offline or the SQL Server instance hosting the Repository is offline | Connection to the collection service is established |
| CLR Error | Error when enabling CLR, creating or modifying the before-after data trigger, or performing a health check | SQL Compliance Manager Agent configuration update or health check is successful |
| Server Connection Error | Error when connecting to the audited instances, due to invalid permissions or the offline SQL Server instance | Connection is established |
| SQL Trace Error | Error when starting or stopping the audit traces | Audit traces are started or stopped |
| Trace Directory Error | Error when creating trace directory or when reaching the maximum size allocated for the trace directory | Trace directory is created or the trace files are transferred to the Collection Server for processing |
Available columns include:
Date
Provides the date that the event occurred.
Time
Provides the time that the event occurred.
Instance Name
Provides the name of the SQL Server instance, using the format SQLServerName\InstanceName.
Event
Provides the type of event that occurred.
Detail
Displays the first line of the event details.
Activity Log Properties
For each event, you can view properties by clicking Event Properties under the gear icon for the associated event. The Activity Log Properties window allows you to view details about an individual event in the Activity Log. You can view the following information:
- Date and time the event occurred
- Type of event
- SQL Server instance on which the event occurred
To scroll from one event to the next, use the up and down arrows.
To copy the event details to another application, click Copy to. This action copies the event details to your clipboard, allowing you to paste the contents into another application such as Microsoft Word.

Change Log view
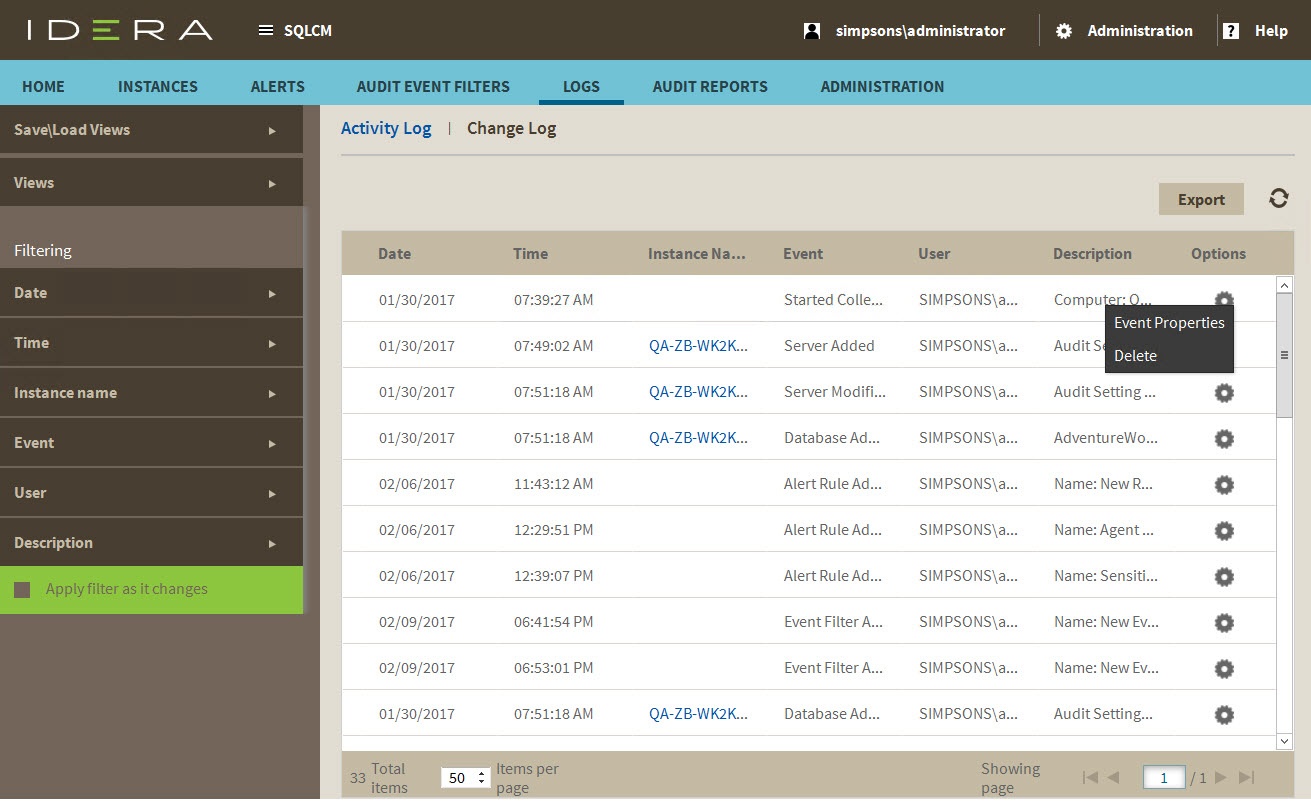
The Change Log view lists changes and events initiated through the Management Console and the Collection Server, allowing you to monitor IDERA SQL Compliance Manager operations and diagnose issues.
Available columns include:
Date
Provides the date that the event occurred.
Time
Provides the time that the event occurred.
Instance Name
Provides the name of the SQL Server instance, using the format SQLServerName\InstanceName.
Event
Provides the type of event that occurred.
User
Provides the name of the user account associated with the event.
Description
Displays the first line of the event details.
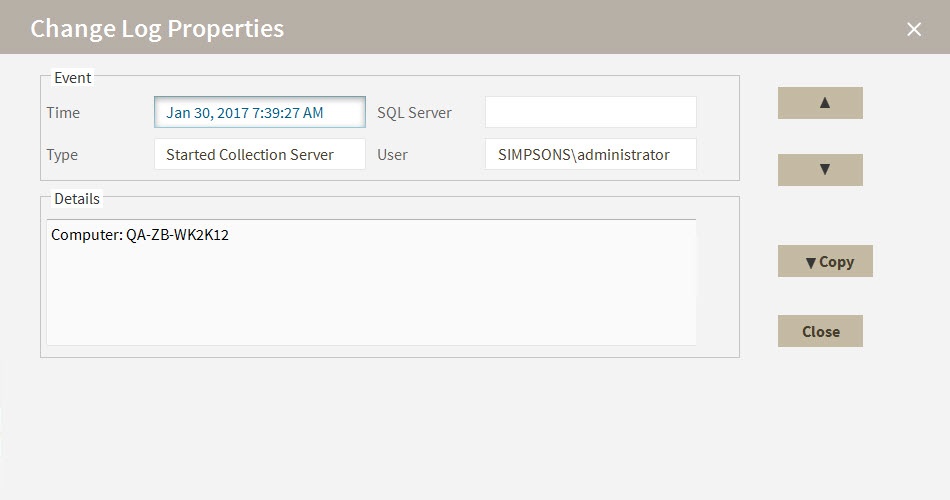
Change Log Properties
The Change Log Properties window allows you to view details about an individual event in the Change Log. You can view the following information:
- Date and time the event occurred
- Type of event
- SQL Server instance on which the event occurred
- User who executed the event
To scroll from one event to the next, use the up and down arrows.
To copy the event details to another application, click Copy. This action copies the event details to your clipboard, allowing you to paste the contents into another application such as Microsoft Word.
...