Versions Compared

Key

  • This line was added.
  • This line was removed.
  • Formatting was changed.

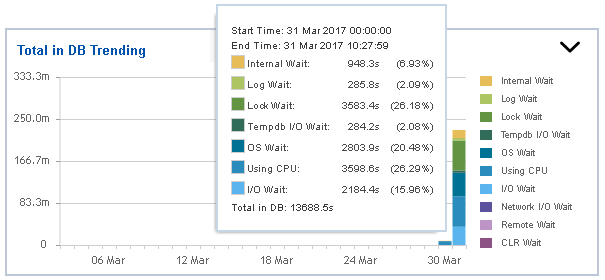
The Total in DB Trending graph displays information measured in seconds about Internal Wait, Log Wait, Lock Wait, Tempdb I/O Wait, OS Wait, Using CPU, I/O Wait, Network I/O Wait, Remote Wait, and CLR Wait. All Waits are color-coded and they are related to the Total in DB Highlights graph.

You can drill down into different time intervals, click and drag the rectangle over the graph.

Image Added


Scroll pdf ignore
Newtabfooter
aliasIDERA
urlhttp://www.idera.com
Newtabfooter
aliasProducts
urlhttps://www.idera.com/productssolutions/sqlserver
Newtabfooter
aliasPurchase
urlhttps://www.idera.com/buynow/onlinestore
|
Newtabfooter
aliasSupport
urlhttps://idera.secure.force.com/
|
Newtabfooter
aliasCommunity
urlhttp://community.idera.com
|
Newtabfooter
aliasResources
urlhttp://www.idera.com/resourcecentral
|
Newtabfooter
aliasAbout Us
urlhttp://www.idera.com/about/aboutus
|
Newtabfooter
aliasLegal
urlhttps://www.idera.com/legal/termsofuse

CPU Activity

TOP WAIT EVENTS TRENDING


TOP WAIT EVENTS

TOP SQL STATEMENTS

TOP PROGRAMS

SERVER CPU UTILIZATION

...