Page History
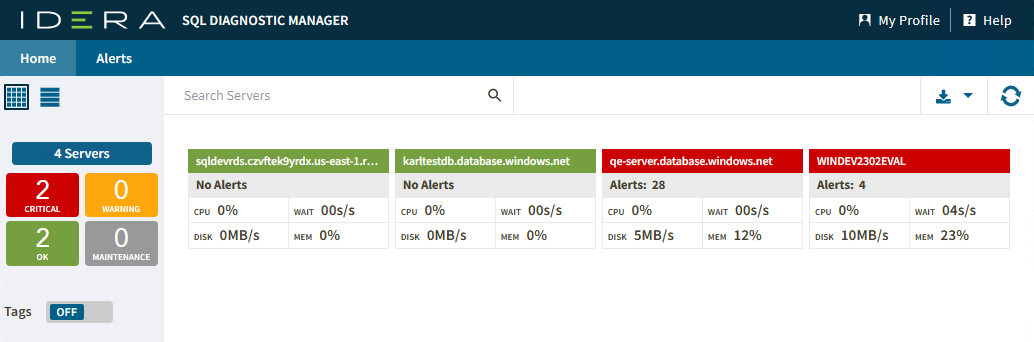
In the Views section of the home Home tab, you can see at a glance if there are any problems in check your monitored SQL Server instances status and drill - down for details. Each view is expandable and information is grouped By Status, By Tags, or by Most Critical Instances. SQL Diagnostic Manager displays this information in the panel to the right. by server status or tags.
Anchor bystatus bystatus
| bystatus | |
| bystatus |
...
Server Status
In the By Status view you You can easily identify the status of your monitored SQL Server instances and take action .
Instances are grouped as follows:
- All Instances
Critical
Successful
Warning
by clicking on one of the following boxes:
 Servers
![]() Critical
Critical
![]() Successful
Successful
![]() Warning
Warning
![]() Maintenance
Maintenance Maintenance Mode
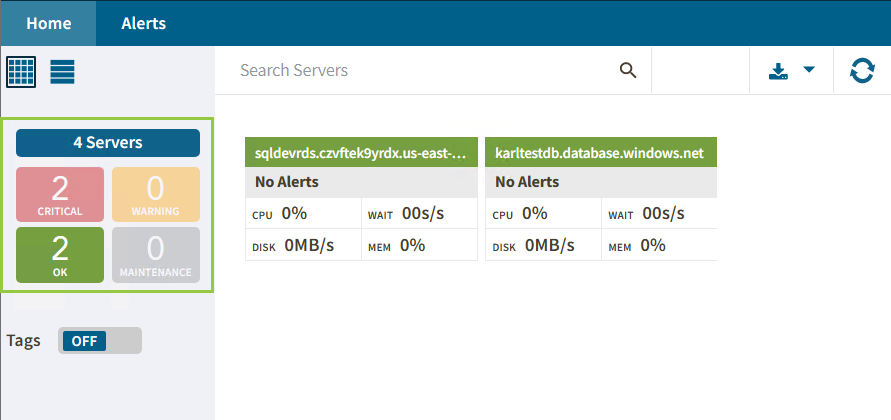
If you select all instances with an OK status in the By Statusserver view, the panel displays information only pertaining to about those instances.
| Info | ||
|---|---|---|
| ||
The number of instances shown on the boxes depends on the number of current servers. |
Anchor bytags bytags
| bytags | |
| bytags |
...
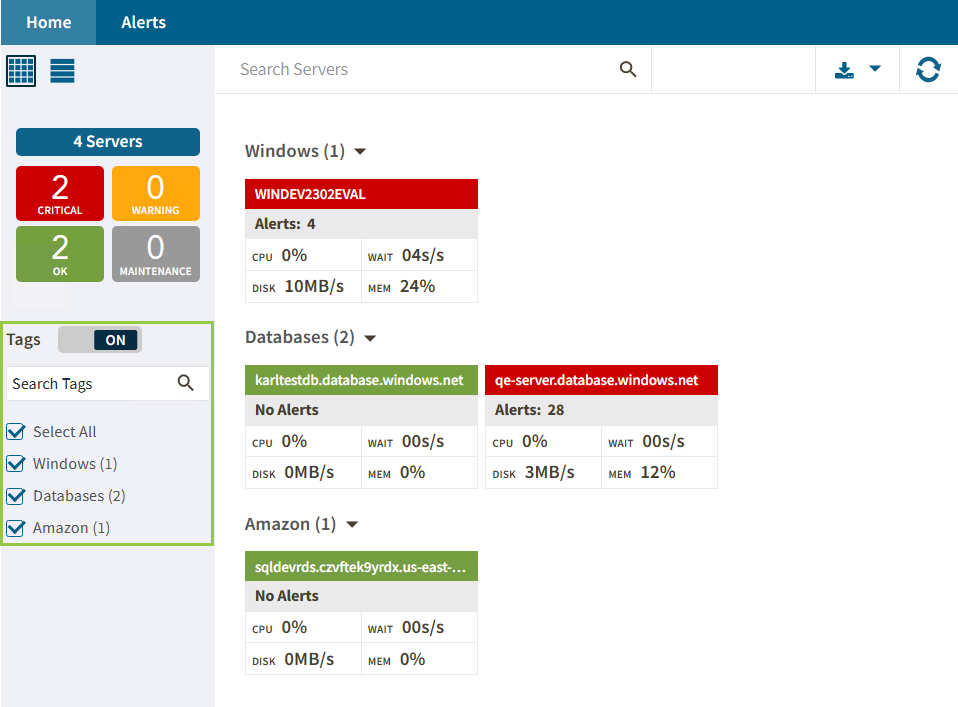
Tags
In the By Tags view, you can SQLDM Web Console allows you to use tags to view the status of different filtered by tags or group groups of instances , and drill down to details.
| Info |
|---|
Remember to turn on the Tags option. Otherwise, you will not be able to select the created tags. For additional information on tags, see Work with tags |
...
The Most Critical Instances view lists all the critical SQL servers in your environment and provides links to the single instance dashboard so you can quickly review the issue. The instance with the largest number of alerts shows up at the top of the list.
...
. |