Page History
This section contains the following topics:
...
| Table of Contents | ||
|---|---|---|
|
...
| Anchor | ||||
|---|---|---|---|---|
|
...
- Settings
- Activities
- Copy Metrics Settings
About editing metric properties
You can edit the properties of each metric that is available in your Precise environment, including Cross-AppTiers metrics, such as: FocalPoints, Agents, Processes, and Licenses. See Editing metric properties.
...
See About metric properties for Action settings.
| Anchor | ||||
|---|---|---|---|---|
|
An environment that is monitored by Alerts may generate alerts at any time. Sitting in front of the screen waiting for a metric to go critical may be strenuous and time consuming. Instead, you can set Alerts to inform you about any alert, or to run your repair utility to fix certain problems.
...
The two tables below indicate how rules are applied when issuing alerts (both Near-Critical and Critical) for different alert transitions (applies to the following actions: email, message, and program):
Table 16-1 Near-Critical
| Old / New | Critical | Near-Critical | Normal | Not sampled |
|---|---|---|---|---|
| Critical | Do not issue | Issue | Do not issue | Do not issue |
| Near-Critical | Issue | Do not issue | Do not issue | Do not issue |
| Normal | Issue | Issue | Do not issue | Do not issue |
| Not Sampled | Issue | Issue | Do not issue | Do not issue |
Table 16-2 Critical
| Old / New | Critical | Near-Critical | Normal | Not sampled |
|---|---|---|---|---|
| Critical | Do not issue | Do not issue | Do not issue | Do not issue |
| Near-Critical | Issue | Do not issue | Do not issue | Do not issue |
| Normal | Issue | Do not issue | Do not issue | Do not issue |
| Not Sampled | Issue | Do not issue | Do not issue | Do not issue |
The table below indicates how rules are applied when issuing alerts for different alert transitions (applies to the following actions: SNMP or MOM):
Table 16-3 SNMP or MOM
| Old / New | Critical | Near-Critical | Normal | Not sampled |
|---|---|---|---|---|
| Critical | Do not issue | Issue | Issue | Issue |
| Near-Critical | Issue | Do not issue | Issue | Issue |
| Normal | Issue | Issue | Do not issue | Issue |
| Not Sampled | Issue | Issue | Do not issue | Do not issue |
| Anchor | ||||
|---|---|---|---|---|
|
Use the Email Action Type to set the email address of the recipient and the message text that will be sent when an alert is raised by the specified metric.
...
- From the Actions tab on the Metric Properties dialog, select the email option on the Action Type list box.
- Select the email action you want to edit.
- Click Delete.
| Anchor | ||||
|---|---|---|---|---|
|
Use the Message Action Type to set the text message that will be displayed on every screen with an open Alerts user interface, when an alert is raised by the specified metric. The message text can also include dynamic parameters.
...
- From the Actions tab on the Metric Properties dialog, select the message option on the Action Type list box.
- Select the message action you want to edit.
- Click Delete.
| Anchor | ||||
|---|---|---|---|---|
|
Use the Program Action Type to set your program to be ran as an action when an alert is raised by the specified metric.
...
- From the Actions tab on the Metric Properties dialog, select the program option on the Action Type list box.
- Select the program action you want to edit.
- Click Delete.
| Anchor | ||||
|---|---|---|---|---|
|
Use the SNMP Action Type to set alerts to be reported to an SNMP based management tool that you may have, such as CA Unicenter® and HP OpenView.
...
- From the Actions tab, select the SNMP option on the Action Type list box.
- To apply SNMP traps, check Send an SNMP trap whenever the metric alert level changes.
- To test your definitions, click Test.
- To save your definitions, choose whether to save them either for the selected instance, or for all the environments’ instances. Then click Save and Close.
| Anchor | ||||
|---|---|---|---|---|
|
Use the MOM Action Type to set alerts to be reported to the MOM server whenever the metric alert level changes.
...
Table 16-4 Dynamic parameters
| Dynamic parameter | Definition |
|---|---|
| $METRIC_NAME | Name of the metric. |
| $METRIC_SET | Name of the metric set. |
| $TECHNOLOGY_NAME | Name of the instance technology. |
| $INSTANCE_NAME | Name of the instance sampled by the metric. |
| $APPTIER_NAME | Name of one of the AppTiers to which the instance applies. |
| $APPTIERS_NAME | Correlated to $ENVIRONMENT_NAME. |
| $ENVIRONMENT_NAME | Name of one of the environments to which the instance applies. |
| $ENVIRONMENTS_NAME | Name of one of the environments to which the instance applies. |
| $METRIC_ALERT | The alert severity level of the metric that was issued when the action was activated. |
| $SAMPLE_REASON | Reason of the sample that caused the action. The reasons can be one of the following:
|
| $ITEMS | Has been deprecated (will not be used in future versions). Use $METRIC_VALUE instead. |
| $METRIC_VALUE |
|
| $METRIC_TIME | The time of the last actual sampling. |
| $SAMPLE_RANGE_START_TIME | The sampling period start time of the last sample. |
| $SAMPLE_RANGE_END_TIME | The sampling period end time of the last sample. |
| $METRIC_PROGRESS | Progress status of the metric. |
| $PROGRESS_UPDATING_USER | Role name of last user that modified the progress status of the metric. |
| $PROGRESS_UPDATE_TIME | Time of the last update of the progress status of the metric. |
| $THRESHOLDS | Warning (near critical) and Critical threshold values defined for the metric. Relevant only for a metric with sub-metrics. |
| $NEAR_CRITICAL_THRESHOLD | Warning (near critical) threshold value defined for the metric. Relevant only for a metric with no sub-metrics. |
| $CRITICAL_THRESHOLD | Critical threshold value defined for the metric. Relevant only for a metric with no sub-metrics. |
| $SERVER_MACHINE_NAME | Name of the server machine on which the instance is running. |
| $SAMPLING_RATE | Sampling rate of the metric. |
| $SAMPLING_PERIOD | Sampling period of the metric. |
| $MIN_VALUE | Minimum value that is acceptable for the metric. |
An example for using dynamic parameters in Email or Message actions can be found in the Message text box in the Email tab (default message).
...
To enable this option, first create a Management Information Bases (MIB) file. The MIB file maps the Alerts database entities, such as the various environments, various instances, and the metrics relevant for each of the instances. Because different sites have different environments, instances, and so on, you must adjust the Alerts MIB file to each site.
Creating an MIB file
Alerts FocalPoint creates the MIB file and displays its status (success or failure) on the standard output. The newly created MIB file name is InformForAlertsMib.mib and is stored in the following directory:
...
On a Linux or UNIX server. <i3_root>/products/pulse/pulsefocal/bin/ createalertsmib.sh
Enabling the Get operation
To use your MIB browser to open the MIB file that you have created and browse the different metrics, you must set the Get parameters on both your SNMP manager and Alerts. The examples provided along with the following instructions relate to the CA Unicenter MIB browser, which is an SNMP management application.
...
- Technology representation
- Identifying environments and instances in the MIB
- Identifying metrics in the MIB
- Identifying property fields in the MIB
- MIB structure
Technology representation
The MIB tree shows the technologies of the Precise environment as the numbers 1 - 15. The table below shows how each number in a MIB tree is mapped to a technology.
Table 16-5 MIB tree mapping
| MIB number | Mapped to ... |
|---|---|
| 1 | Oracle |
| 2 | Sybase |
| 3 | MS-SQL |
| 4 | Tuxedo |
| 5 | Web |
| 6 | J2EE |
| 7 | SAP |
| 8 | Oracle Applications |
| 9 | Microsoft .NET |
| 10 | RESERVED |
| 11 | EMC Storage |
| 12 | Other |
| 13 | OS |
| 14 | Precise status |
| 15 | WebSphere MQ |
| 16 | Sybase Replication Server |
| 17 | DB2 |
Identifying environments and instances in the MIB
Alerts displays environments and instances by their names (environment_name, instance_name), while the MIB presents them by their identifiers (environment_id, instance_id).
...
- Retrieve a mapping table that maps the environment and instance names to their identifiers by running the following SQL statement in the Alerts schema:
select
INCE_ID INSTANCE_ID, INCE_NAME
INSTANCE_NAME, INEN_ID
ENVIRONMENT_ID, INEN_NAME
ENVIRONMENT_NAME
from
PS_INCE_INSTANCE_INSTANCE, PS_INII_INSTANCE_APPTIER
INSTANCE_APPTIER, PS_INAP_APP_TIER APPTIER,
PS_INEN_ENVIRONMENT ENVIRONMENT
where
INCE_ID = INII_INCE_ID AND
INAP_ID = INII_INAP_ID AND
INAP_INEN_ID = INEN_ID AND
INCE_DELETED = ‘F’ AND
INII_DELETED = ‘F’ AND
INAP_DELETED = ‘F’ AND
INEN_DELETED = ‘F’ AND
Identifying metrics in the MIB
Alerts displays metrics by their names (metric_name), while the MIB presents them by their identifiers (metric_id).
...
- Retrieve a mapping table that maps between the metric names and their identifiers by running the following SQL statement in the Alerts schema:
select indicator_id,indicator_name, from pulse_indicators order by indicator_name;
Available property fields in the MIB
The table below describes the available property fields for a metric.
Table 16-6 Available property fields in the MIB
| No. | Field | Description | Applies to |
|---|---|---|---|
| 0 | Value | Specifies the metric's value. Same as the dynamic parameter: Displayed in the Value metrics tab only. In case of a parent metric, only the sub-metrics show this field. | Get |
| 1 | Status | Specifies the metric's status. Possible values: Critical, Near-critical, Normal, and Unsampled. In the MIB browser, Downtime and Disabled statuses appear also as Unsampled status. | Get |
| 2 | SampleRate | Specifies the sampling rate in minutes. Same as the dynamic parameter: In case of a parent metric, only the parent shows this field. | Get |
| 3 | NearCrThr | Specifies the metric's Near-critical threshold. Same as the dynamic parameter: In case of a parent metric, only the sub-metrics show this field. | Get |
| 4 | CriticalThr | Specifies the metric's Critical threshold. Same as the dynamic parameter: In case of a parent metric, only the sub-metrics show this field. | Get |
| 5 | Enabled | Specifies whether or not the metric is enabled (values: yes or no). | Get |
| 6 | SampleTime | Specifies the metric's last sampling time. Same as the dynamic parameter: | Get |
| 7 | MetricName | Specifies the metric's name. Same as the dynamic parameter: | Get |
| 8 | InstanceName | Specifies the instance's name. Same as the dynamic parameter: | Get |
| 9 | ItemsTable | Specifies the list of items returned by the metric sampling. Same as the dynamic parameter: Displayed in the list of items of the metrics list. For parent metrics, the list contains also the sub-metrics. | Get |
| 10 | Technology | Specifies the Technology name. Same as the dynamic parameter: | Get |
| 11 | Machine | Specifies the Machine name. Same as the dynamic parameter: | Get |
| 12 | AppTier | Specifies the AppTier name. Same as the dynamic parameter: | Get |
| 13 | Environment | Specifies the Environment name. Same as the dynamic parameter: | Get |
| 14 | MetricID | Specifies the Metric ID name. | Get |
| 15 | Returned value | Specifies the Returned value name. Same as the dynamic parameter: | Get |
| 16 | Thresholds | Specifies the Thresholds name. Same as the dynamic parameter : | Get |
MIB structure
The Alerts MIB structure complies with the Alerts SNMP Object Identifier (OID) structure. The OID of the Alerts Get requests for a specified metric is:
...
Alerts supports both SNMP message versions, SNMPv1 and SNMPv2. Alerts sends traps when a change occurs in a metric severity level, that is, when the metric state is changed between the following states: Critical, Near-Critical, Normal, and Unsampled.
Alerts trap message
The following is an example of an Alerts'SNMP trap message:
...
Table 16-7 SNMP trap structure
| Description | Abbreviated object identifier (OID) |
|---|---|
| Metric | 7 |
| Instance | 8 |
| Technology | 10 |
| Machine | 11 |
| AppTier | 12 |
| Environment | 13 |
| Sampled on | 6 |
| Alert | 1 |
| Value | 15 |
| Thresholds | 16 |
| Message until v. 8.0 | 0 |
The trap can be parsed with a commercial trap catcher according to the position of the varbinds or their OID. The following apply only to the last varbind on the table (OID=0):
...
To activate and deactivate the Alerts integration with the MOM server, go to “Setting Setting a MOM server for actions on the MOM tab. See “Setting a MOM server for actions on the MOM tab” on page 62.
Setting anonymous access to a MOM server
Before integrating Alerts with the MOM server in AdminPoint, anonymous access to the MOM Web console must be set.
To set anonymous access to the MOM server1. Open
- Open the IIS Manager on the MOM server.
...
- Select to open the “Microsoft Operations Manager Web console” properties screen.
...
- Click the Directory Security tab.
...
- On the “Anonymous access and authentication control” panel, click Edit.
...
- Mark “Enable Anonymous access” and type in the username and password (to be used for MOM integration setup on the AdminPoint Alerts General Settings screen).
...
- Save the changes.
Issuing rules for MOM actions
If MOM action is defined for a metric, MOM integration is activated and a MOM action is issued every time a metric's alert changes.
| Info |
|---|
...
For disabled metrics, the metric's initial status is not reported to MOM. The metric is only reported when the disabled status changes to another status. Disabled metrics do not appear in the MOM console. |
Display of MOM alerts in the MOM server
The MOM alert can be displayed only when integration between Alerts and the MOM server is activated and the registration process is completed successfully. A MOM alert can be the result of either clicking the Test button or of a real action performed by the Alerts FocalPoint.
When you open the MOM Operator Console, select Alert Views in the Alert Views pane. The figure below displays the MOM Operator console user interface
Figure 16-1 MOM 1 MOM Operator console
Alert Views pane
Alerts View Results
Alerts Details pane
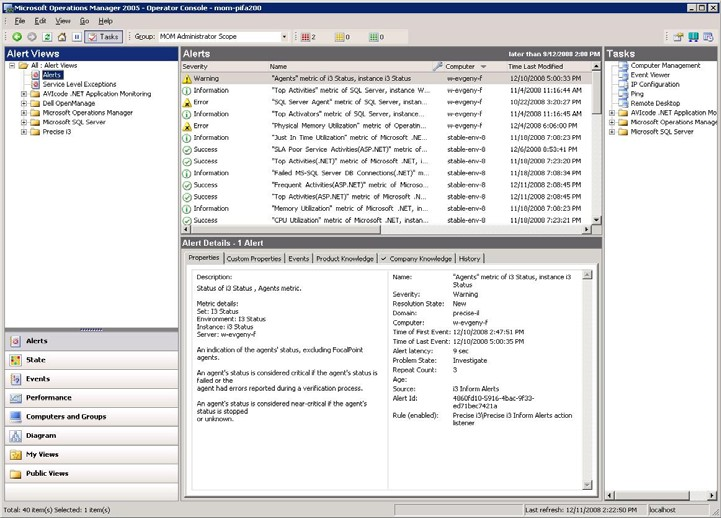
If you If you have successfully installed the Precise Management Pack (see Precise Installation Guide), you will see a Precise folder in the Alert Views tree. This folder displays on the Alerts View Results pane, all actions generated as MOM alerts.
...
The table below shows the different MOM severities displayed in the MOM operator console according to the Alerts alert levels.
Table 16-8 Alert 8 Alert level names in the MOM operator console
| Alerts |
|---|
...
| alert | MOM severity |
|---|---|
| Normal | Success |
| Near_ |
...
| Critical | Warning |
| Critical | Error |
...
| Critical (Key Metric) |
...
| Critical Error | |
| Not |
...
| Sampled | Unknown (alert will not be seen in the MOM console) |
Default SQL Server and MS .NET metrics MOM actions definitions
Alerts is delivered with a set of predefined MOM alert actions for metrics monitored by Precise Microsoft technologies.
| Anchor | ||||
|---|---|---|---|---|
|
...
To sample customized metrics, InformPoint must be installed on the sampled instance server. In the case of a remote SQL server instance, the InformPoint that samples the instance is the one installed on the remote SQL server collector.
Creating customized executable files
A customized metric can be associated with a host script that you create, so that Alerts operatively monitors a parameter specific to your environment.
Save the host script in the server machine where the sampled instance is running, in the directory:
<i3<i3_root>root>\products\pulse\userprograms.
Although the root directory of the running script is <i3<i3_root>root>, the program runs from the userprograms directory.
To simulate a run of customized metric, use a command line shell and type from the Precise root directory:For
Windows
...
.\products\pulse\userprograms\MYPROG.bat.
...
UNIX or Linux
...
./products/pulse/userprograms/MYPROG.sh.
You can create a customized metric that returns a single value or a list of values. A customized metric that returns a single value is created by apply the following guidelines:• The
- The script must return a single value to the Standard Output (
echocommand). The type of the value must be numeric or float. Alerts compares this value to the customized metric thresholds to determine the metric alert status.
...
- The script must output only the value. To avoid that commands be printed, Windows scripts must start with
@echo off. UNIX scripts must start with the shell type, for example#!/bin/ksh.
...
- You can use dynamic parameters for customized metrics in the command line.
See Using dynamic parameters in customized metrics.
A customized metric that returns a table with multiple values is created by apply the following guidelines:• The
- The script must return a list of values to the Standard Output (
echocommand). Each line in the output must contain a name and a value separated by a tab (\t only, not a space). The value must be numeric or float. Alerts compares these values to the customized metric thresholds to determine the metric alert status.
...
- The script must output only the value. To avoid that commands be printed, Windows scripts must start with
@echo off. UNIX scripts must start with the shell type, for example#!/bin/ksh.
...
- In some operating systems, the tab character may be ignored when printing it using the echo command. In those cases, use the ' character around the text, as follows:
echo 'Alerts 80'.
You can use dynamic parameters for customized metrics in the command line. See Using dynamic parameters in customized metrics.
| Info |
|---|
...
It is recommended to test your scripts in your environment before running them through Alerts. For UNIX scripts, verify that the script has rx security permissions. |
Windows script examples
The examples for Windows scripts, whose file names end with _example, are listed in the following tables. These files can be found also in any server where InformPoint is installed, in the directory:
<i3<i3_root>root>\products\pulse\userprograms
The table below shows an example of customized metrics with a single value.
Table 16-9 Example 9 Example of customized metrics with a single value - Windows
| Script |
|---|
...
| file | Script lines | Description |
|---|---|---|
| simple_example. |
...
| bat | @ECHO OFF ECHO |
...
| <value> | This script returns a constant value that creates a straight line graph. |
| simple2_example. |
...
| bat | @ECHO OFF <program_run_command> ECHO %ERRORLEVEL% |
...
| This script indicates whether or not a certain program is running. The script returns 0 if the program runs with no errors, and n>0 if errors occurred. You can set Near-Critical threshold to 1 to alert each time the program fails. |
The table below shows an example of customized metrics with multiple values.
Table 16-10 Example 10 Example of customized metrics with multiple values (table type) — Windows
| Script file | Script |
|---|
...
| lines | Description |
|---|---|
| table_example. |
...
| bat | @ECHO OFF |
...
| 2 | This script returns a list of items including their values for each sample. A tab character (not space) separates between the item name and the item value. |
UNIX/Linux shell script examples
The examples for UNIX/Linux shell scripts, which their file names end with _example, are listed in the following tables. These files can be found also in any server where InformPoint is installed, in the directory:
<i3<i3_root>root>/products/pulse/userprograms.
The table below shows an example of customized metrics with a single value for UNIX or Linux scripts.
Table 16-11 Examples 11 Examples of customized metrics with a single value (UNIX/Linux)
| Script |
|---|
...
| file | Script lines | Description |
|---|---|---|
| simple_example. |
...
| sh | #!/bin/ksh echo |
...
| <value> | This script returns a constant value that creates a straight line graph. |
| simple2_example. |
...
| sh | #!/bin/ksh |
...
fi | This script counts the number of characters of a specified text file. For example, you can set the metric thresholds to alert when the file size exceeds a certain size. |
The table below shows an example of customized metrics with multiple values (table type) for UNIX or Linux scripts.
Table 16-12 Example 12 Example of customized metrics with multiple values (table type) - UNIX/Linux
| Script file | Script |
|---|
...
| lines | Description |
|---|---|
| table_example. |
...
| bat | #!/bin/ksh echo 'Demo 0' echo 'Demo2 1' echo 'Demo3 2' |
...
| This script returns a list of items including their values for each sample. A tab character (not space) separates between the item name and the item value. |
...
Creating customized stored procedures
To monitor a parameter specific to Oracle or SQL Server AppTiers, you can create a stored procedure and connect it to a customized metric of Alerts. The type of your stored procedure, Oracle or MS-SQL, must be according to your PMDB type.
In addition, the stored procedure can be defined only in Oracle or SQL Server AppTier instances. To create Oracle stored procedure metrics, you must install the Precise for Oracle FocalPoint with at least one instance. To create MS-SQL stored procedure metrics, you must install the Precise for SQL Server FocalPoint with at least one instance.
Creating MS-SQL stored procedures
When creating a stored procedure in MS-SQL, apply the following guidelines:
To create MS-SQL stored procedures1. Connect
- Connect to the database as Precise for SQL Server user.
...
- Ensure that the name of the stored procedure includes the database name. For Oracle users, the procedure name must not end with a semicolon (;).
...
- The naming convention for the program in Alerts must be:
databaseName..
...
Procedure().
...
Verify that the return value of the execution is a single numeric value (integer).
...
Info You can use any procedure and an unlimited number of parameters, including no parameters.
To create an MS-SQL stored procedure1. Apply
- Apply the following format:
CREATE PROCEDURE user_def @@var1 type1, ...., @@var-n type-n
AS
- Custom query
GO
...
- Use the following format within the call from the customized metric (the code should be entered in the Program box when adding a new Customized Metric):
user_database..user_def val1, ...., val-n
Example of an MS-SQL stored procedure
The following stored procedure enables Alerts to send an email when the number of rows in a table called SALES.ITEMS reaches an amount that you set in the Thresholds tab.
To apply the MS-SQL stored procedure1. Connect to
- Connect to the database schema of the Precise for SQL Server.
...
- Create the function
user_defin the user_database as follows:
CREATE PROCEDURE user_def @@sampling_rateint,@@sampling_period int
AS
SELECT count(*) FROM SALES..ITEMS
GO
...
- When you create the customized metric under the MS-SQL instance, set the program name to:
SALES..user_def @SAMPLING_RATE, @SAMPLING_PERIOD
Use dynamic parameters. See Using dynamic parameters in customized metrics.
To test the MS-SQL stored procedure1. Connect
- Connect to the database schema of the Precise for SQL Server.
...
- Run the function
user_defin the user_database as follows:
user_database..user_def sampling_rate , sampling_period
Creating Oracle stored procedures
When creating a stored procedure in Oracle, apply the following guidelines:
To create Oracle stored procedures1. Connect
- Connect to the database as Precise for Oracle user.
...
- Ensure that the name of the stored procedure includes the package name and ends without a semicolon (;).
...
- The naming convention for the program in Alerts must be:
PackageName.ProcedureName().
...
- Verify that the return value of the execution is a single numeric value (integer).
To create the Oracle stored procedure package• Apply
- Apply the format as follows:
Create or replace package user_defined_pack as
function user_def(var1 type1, .... , var-n type-n)
return return-type;
pragma restrict_references(user_def,WNDS,WNPS);
end user_defined_pack;
/
To create the Oracle stored procedure package body and insert your custom code into the user defined functions1. Apply
- Apply the following format
Create or replace package body user_defined_pack as
function user_def(var1 type1, ...., var-n type-n) return
return- type is
begin
-- Custom
code end
user_def;
end user_defined_pack;
...
- Use the following format within the call the call from the customized metric (the code should be entered in the Program box when adding a new Customized Metric):
user_database..user_def val1, ...., val-n
You can use any package or function name, and an unlimited number of parameters (including NONE).
Example of an Oracle stored procedure
The following stored procedure enables Alerts to send an email when the number of rows in a table called ITEMS, which belongs to a user called SALES, reaches an amount that you set in the Thresholds tab.
To apply the Oracle stored procedure1. Connect
- Connect to the database schema of the Precise for Oracle.
...
- Create the package
user_defined_packas follows:
Create or replace package user_defined_pack as
function user_def(sampling_rate number, sampling_period
number, warning_threshold number, critical_threshold number)
return number; pragma
restrict_references(user_def,WNDS,WNPS);
end user_defined_pack;
/
...
- Run the following script in the Precise for Oracle database schema to create the package body of package user_defined_pack:
Create or replace package body user_defined_pack as
function user_def(sampling_rate number, sampling_period
number, warning_threshold number, critical_threshold number)
return number is
tbl_num_rows number; BEGIN
select num_rows into tbl_num_rows from sys.dba_tables where
table_name='ITEMS' and owner='SALES';
return (tbl_num_rows);
end user_def;
end user_defined_pack;
/
...
- When you create the customized metric under the Oracle instance, set the program name to:
user_defined_pack.user_def ( @SAMPLING_RATE , @SAMPLING_PERIOD ,
@NEAR_CRITICAL_THRESHOLD , @CRITICAL_THRESHOLD )
Use dynamic parameters. See Using dynamic parameters in customized metrics.
To test the Oracle stored procedure1. Connect
- Connect to the database schema of the Precise for Oracle.
...
- Run the function user_def in the user_database with your values as follows:
select user_defined_pack.user_def(sampling_rate,
sampling_period, warning_threshold,
critical_threshold) as value from dual;
| Anchor | ||||
|---|---|---|---|---|
|
When you set a customized metric, you can use dynamic parameters in the Program command line.NOTE The
| Info |
|---|
The dynamic parameters in customized metrics are not the same as used in actions. |
The table below describes the dynamic parameters that you can use in customized metrics.
Table 16-13 Dynamic 13 Dynamic parameters
| Dynamic |
|---|
...
| parameter | Definition |
|---|---|
| @METRIC_ |
...
| ID | ID of the customized metric. |
| @METRIC_ |
...
| NAME | Name of the customized metric. |
| @INSTANCE_ |
...
| ID | ID of the instance that is sampled by the customized metric. |
| @INSTANCE_ |
...
| NAME | Name of the instance that is sampled by the customized metric. |
| @SERVER_MACHINE_ |
...
| NAME | Name of the server machine on which the InformPoint agent is installed. |
| @INSTANCE_SERVER_MACHINE_ |
...
| NAME | Name of the server machine on which the instance is running. (May be differ from |
...
| @SERVER_MACHINE_NAME only on MS-SQL instances.) |
| @TECHNOLOGY_ |
...
| CODE | The code of the metric's technology. |
| @SAMPLING_ |
...
| RATE | Sampling rate (in minutes). |
| @ANSI_CURRENT_ |
...
| TIME | Timestamp of the sampling. |
| @WARNING_ |
...
| THRESHOLD | Warning (near critical) threshold value. |
| @CRITICAL_ |
...
| THRESHOLD | Critical threshold value. |
| @INCLUDE_ |
...
| LIST | Include list of the items to consider when sampling data (the format is: value1, value2, value3, ...). The values of this parameter equal to the values that you set in the Consider only the following items text box in the threshold tab. See |
...
...
tab. |
| @EXCLUDE_ |
...
| LIST | Exclude list of the items to ignore when sampling data (the format is: value1, value2, value3, ...). The values of this parameter equal to the values that you set in the Ignore the following items text box in the threshold tab. See |
...
...
tab. |
Precise. Performance intelligence from click to storage. Learn more > >
...