Page History
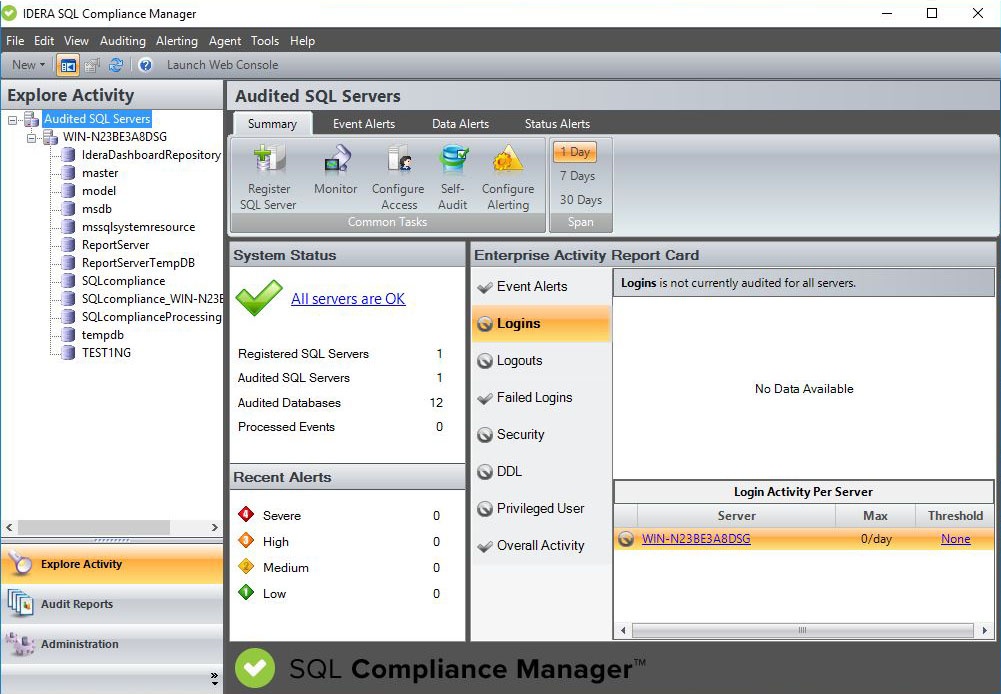
Audited SQL Servers Summary
The Audited SQL Servers Summary tab (Management Console) displays the status of audit activity across your SQL Server environment. Use the statistics and graphs on this tab to quickly and easily identify issues so you can continue to ensure the correct level of compliance.
Understanding System Status
The System Status pane displays the overall status of your SQL Server environment.
Status
Indicates whether IDERA SQL Compliance Manager
...
encountered any issues while auditing your SQL Server environment.
Clicking the status link opens the more detailed Registered SQL Servers tab under Administration. Use this tab to
...
view the status of audited databases on this instance, validate audit settings, and check the
...
SQL Compliance Manager Agent status.
| Status Type | Possible Causes |
|---|---|
| Alert/Error |
|
|
|
|
|
|
|
|
|
|
| |
| OK | SQL Compliance Manager is performing as expected. |
| Warning |
|
|
|
|
|
|
|
|
|
|
|
|
|
Registered SQL Servers
Displays the number of SQL Server instances that are registered with SQL
...
Compliance Manager.
Audited SQL Servers
Displays the number of instances currently
...
audited. This number does not include instances where auditing is not yet configured or is disabled.
Audited Databases
Displays the number of databases currently
...
audited. These databases are hosted by SQL Server instances that are registered with SQL
...
Compliance Manager. This number does not include databases where auditing is not yet configured or is disabled.
Processed Events
Displays the number of audit events stored in the Repository event databases for the selected time span. This number does not include
...
previously archived or groomed events.
Understanding the Enterprise Activity Report Card status
Each tab of the Enterprise Activity Report Card provides an auditing status for the corresponding event category. You can use Use this status to help you determine whether you are effectively auditing events in your environment.
You can also use auditing thresholds to display critical issues or warnings should a particular activity, such as privileged user events, be higher than expected. These thresholds can notify you about issues related to increased activity levels, such as a security breach, that may be occurring on this instance. Use thresholds to supplement the alert rules you have configured for your environment.
| Status Type | Indication | Meaning |
|---|---|---|
| Audited without thresholds | gray check | This event category is |
| audited on instances in your environment, but auditing thresholds are not set for this event category. Consider setting audit thresholds so you can track peaks in activity and identify any suspicious events. | ||
| Critical | red icon | The event activity during the selected time span is higher than the defined critical threshold. To see more information about this activity, navigate to the Audit Events tab and search for events in the flagged event category |
| . You can view the detailed properties of an event by double-clicking the listed event. | ||
| OK | green check | This event category is |
| audited on instances in your environment and auditing thresholds are set for this event category. | ||
| Not audited | red icon | This event category is not |
| audited on instances in your environment even though auditing thresholds are set for this event category. To track this activity, change your audit settings to include the corresponding event category. To ignore this activity, disable the auditing threshold set for this event category. | ||
| Not audited and no thresholds set | gray circle | This event category is not |
| audited on any instances in your environment. Auditing thresholds are not set for this event category. Review whether you need to audit and track this activity on any of your SQL Server instance. | ||
| Warning | yellow icon | The event activity during the selected time span is higher than the defined warning threshold. To see more information about this activity, navigate to the Audit Events tab and search for events in the event category that is flagged. You can view the detailed properties of an event by double-clicking the listed event. |
Understanding the Enterprise Activity Report Card tabs
The Enterprise Activity Report Card tabs (Report Card) chart recent activity for each of the common audit event categories and provide the status of each registered SQL Server instance. This activity and status is calculated for the selected time span from the processed audit events stored in the Repository event databases.
Use the Report Card to track the rate of activity in specific event categories and identify when exceptional activity occurs. Auditing thresholds can also help you track and identify activity that could reflect a SQL Server performance or security issue.
To get more detailed information about a particular SQL Server instance, use the provided link.
Understanding Recent Alerts
The Recent Alerts pane displays the number of alerts that are generated for each alert category in the selected time span. If you see an unexpected number of alerts, consider reviewing the current alert messages and then modifying your alert rules to better fit your compliance and auditing needs.
For more information about specific alerts, see the Alerts tab. You can view which alerts have been are generated from multiple instances across your environment or from a particular instance.
Available actions
Register SQL Server
Starts the New Registered SQL Server wizard, allowing you to enable and configure auditing on another SQL Server instance.
Monitor
Opens the Change Log tab under Administration, allowing you to monitor what types of changes
...
are made to audit settings across your environment.
Configure Access
Opens the SQL Logins tab under Administration, allowing you to control who has access to view and report on audit data or change configuration settings.
Self-Audit
Allows you to perform an integrity check on the audit data currently stored in Repository.
Configure Alerting
Opens the Alert Rules tab under Administration, allowing you to configure alerting to track specific activity on SQL Server instances across your environment.
Span
Allows you to change the number of days (time span) for which the Summary tab displays status, alerts, and activity. By default, this tab displays data for the last seven days.
...
SQL Compliance Manager audits all activity on your server. Learn more > >
...