Page History
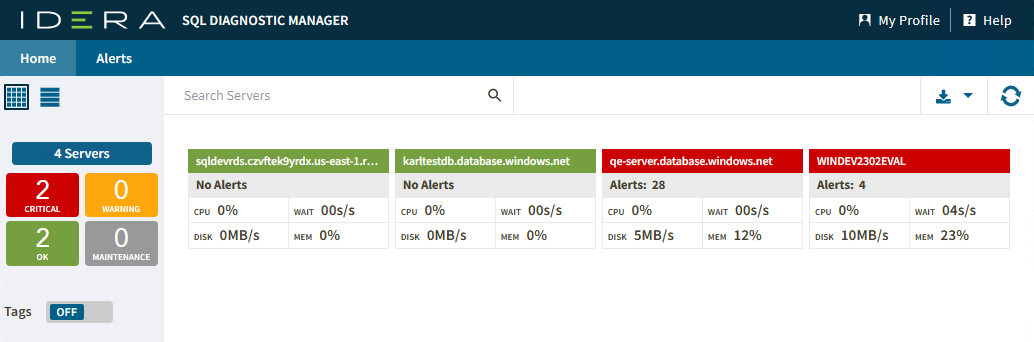
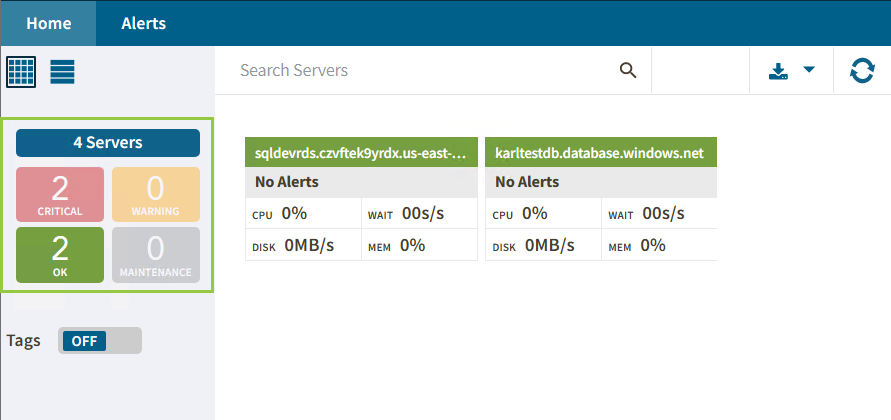
In the Views section of the Home tab, you can see at a glance check your monitored SQL Server instances status and drill down for details. Each view is expandable and information is grouped by server status or tags.
IDERA Web Console displays the instance information in the right panel and the filters on the left panel.
Anchor bystatus bystatus
Server Status
| bystatus | |
| bystatus |
You can easily identify the status of your monitored SQL Server instances and take action by clicking on one of the following boxes:
...
 Servers
![]() Critical
Critical
![]() Successful
Successful
![]() Warning
Warning
...
If you select all instances with an OK status in the server view, the panel displays information only pertaining to about those instances.
| Info | ||
|---|---|---|
| ||
The number of instances shown on the boxes depends on the number of current servers. |
Anchor bytags bytags
Tags
| bytags | |
| bytags |
IDERA SQLDM Web Console allows you to use tags so you can to view the status of different filtered by tags or groups of instances , and drill down to details.
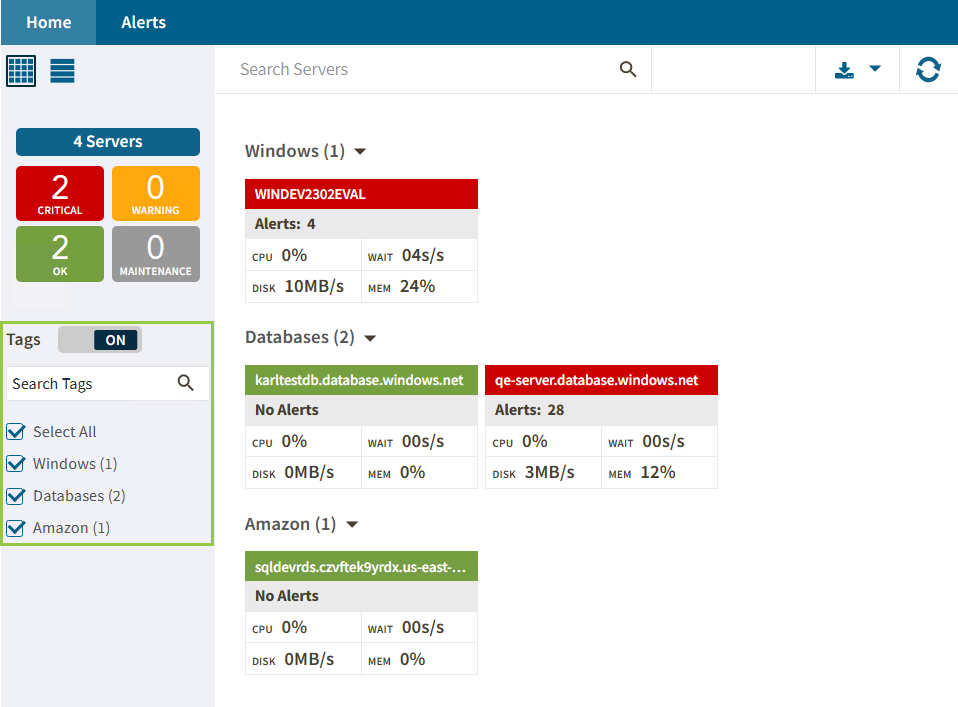
| Info |
|---|
Remember to turn on the Tags option. Otherwise, you will not be able to select the created tags. For additional information on tags, see Work with tags. |