Page History
...
| Info | ||
|---|---|---|
| ||
SQL Diagnostic Manager allows you to launch SQL Workload Analysis in context of your monitored SQL Server instance from both, the desktop client and the IDERA Dashboard. You can launchWhen the monitored instance it is registered in SQL Workload Analysis from the single instance view and its tabs of the SQLDM web console. The icon Launch SWA located on the top-right side of the screen is available when your instance is registered in SQL Workload Analysis product., the Launch SWA icon displays on the right side of the History Range Control. Click the Launch SWA icon to be redirected to SQL Workload Analysis. |


In the single instance dashboard, you can find the following sections:
- History Range Control
- Alert and Health Summary
- Prescriptive Analysis SummaryServer status
- Server properties
- Service status
- File use
- Databases roll up view
- Charts
- Category views
...
Anchor HR HR
History Range Control
| HR | |
| HR |
SQL Diagnostic Manager also includes a new History Range Control, located at the top of the Web Console and in the option History Browser in the Desktop Console, both can be modified and be designated a specific start time and date as well as a current snapshot.

Anchor AHS AHS
Alert and Health Summary
| AHS | |
| AHS |
In this section, you find the health index, the alert status, and the user sessions from SQL Diagnostic Manager. Also, includes shortcuts to filter data through Sessions, Queries, Resources, and Databases.
Anchor PAS PAS
Prescriptive Analysis Summary
| PAS | |
| PAS |
The prescriptive summary shows the previous analysis information and the resulting recommendations summary. You can click any category under Recommendation Summary to be redirected to the Analyze tab in the desktop console
...
In this section view the status of your monitored SQL Server and its alerts.
Anchor SP SP
Server
| SP | |
| SP |
...
Properties
In this section view the most important characteristics of your monitored SQL Server instance.
Instance Name
...
Displays the name of the monitored SQL Server instance or its friendly name assigned in the desktop console.
| Tip |
|---|
Assign a friendly name to your instance that is meaningful to you and easy to identify. |
SQL Version
Indicates the current SQL Server SQL Server version including service pack and build information on this SQL Server SQL Server instance.
SQL Edition
Indicates the current SQL Server SQL Server edition, including Enterprise, Business Intelligence, or Standard, installed on this SQL Server SQL Server instance.
Running since
Indicates the timestamp associated with the most recent restart of this SQL Server SQL Server instance.
Clustered
Indicates whether this SQL Server SQL Server instance is part of a cluster. If it is part of a cluster, SQL Diagnostic Manager displays the name of the active node.
Processors
Indicates the total number of processors associated with this SQL Server SQL Server instance and how many of these processors are currently in use.
Host
Indicates the name of the server hosting this SQL Server SQL Server instance.
Host
...
Indicates the current operating system on the server hosting this SQL Server instance.
...
Memory (GB)
Indicates the total amount of memory on the server hosting this SQL Server SQL Server instance.
...
In this section view the status of the SQL Server services:
- SQL Server Service
- SQL Agent Service
- Distributed Transaction Coordinator (DTC) Service
...
Host OS
Indicates the current operating system on the server hosting this
...
SQL Server instance.
Data
...
Size
Displays the allocated data space in GB for this SQL Server instance.
...
Log File (Used GB)
...
Database count
...
The Databases roll up view shows the monitored databases for the selected instance. Information provided includes:
Database
Displays the database name.
Creation Date
Displays database creation date and time.
Data Size (MB)
Displays the size of all data files used in this SQL Server instance.
Log Size (MB)
Indicates the current size of the log files on this SQL Server instance.
Status
Indicates the operational status of the database such as Normal, Offline, or Suspect.
If you click any row of the Database roll up view, SQL Diagnostic Manager directs you to the databases tab of the single instance dashboard for more details.
...
data size of the server.
Log Size
Displays the log size of the server.
| Anchor | ||||
|---|---|---|---|---|
|
The Prescriptive Analysis panel shows a summary of the performed Analyses, this panel shows the Date, the Duration, the Task Type, the number of recommendations, the Priority, and you can click the Show Recommendations to review the list of recommendations of each Analysis.
Anchor ATL ATL
Alert Timeline
| ATL | |
| ATL |
This graph shows a summary of the alert categories, CPU, Memory, I/O, Databases, Logs, Queries, Services, Sessions, Virtualization, Operational and Custom. This graph is color-coded depending on the status of the alerts inside each category.
| Anchor | ||||
|---|---|---|---|---|
|
This alert timeline view allows you to easily identify the highest alert for your monitored SQL Server instance and the highest alert for a specific category.
Configure the Alert Category graph, following these steps:
- Click Edit, located next to the Alert Timeline graph.
- Check or uncheck the checkboxes located under the Visible column.
- Or, reorganize the Order column with the listed numbers preferred.
- Click Save.
Anchor charts charts
Charts
| charts | |
| charts |
The single instance dashboard includes the following charts:

Response Time
The Response Time chart displays the response time (in milliseconds) it takes a Select SQL statement to go to the SQL Server instance and back. This chart indicates the current speed and congestion of the network as well as the speed with which SQL Server processes small queries. To obtain additional key diagnostic statistics for sessions on your SQL Server instance, click the chart and you’re directed to the Sessions > Overview view. This view contains various charts like the Response Time (ms), Session Activity, and Blocked Sessions.
SQL Server CPU Activity
The SQL Server CPU Activity chart displays the percentage of a CPU consumed by your SQL Server, virtual machine, and host server. To obtain additional key diagnostic statistics for monitoring the resources for your SQL Server instance and computer on which it resides, click the chart and you’re directed to the Resources > CPU view. This view contains various charts like the CPU Usage (%), Processor Time (%), and Processor Queue Length.
OS Memory Usage
The OS Memory Usage chart displays information in GB on the physical and virtual memory in use during the current day. To obtain additional key memory statistics on the computer hosting your SQL Server instance, click the chart and you’re directed to the Resources > Memory view. This view contains various charts like SQL Memory Usage (MB), Memory Areas (MB), and Page Life Expectancy (sec).
Disk Busy
...
the option MANAGE GRAPHS. This option allows you to choose the following graphs to be displayed in the overview single instance view:
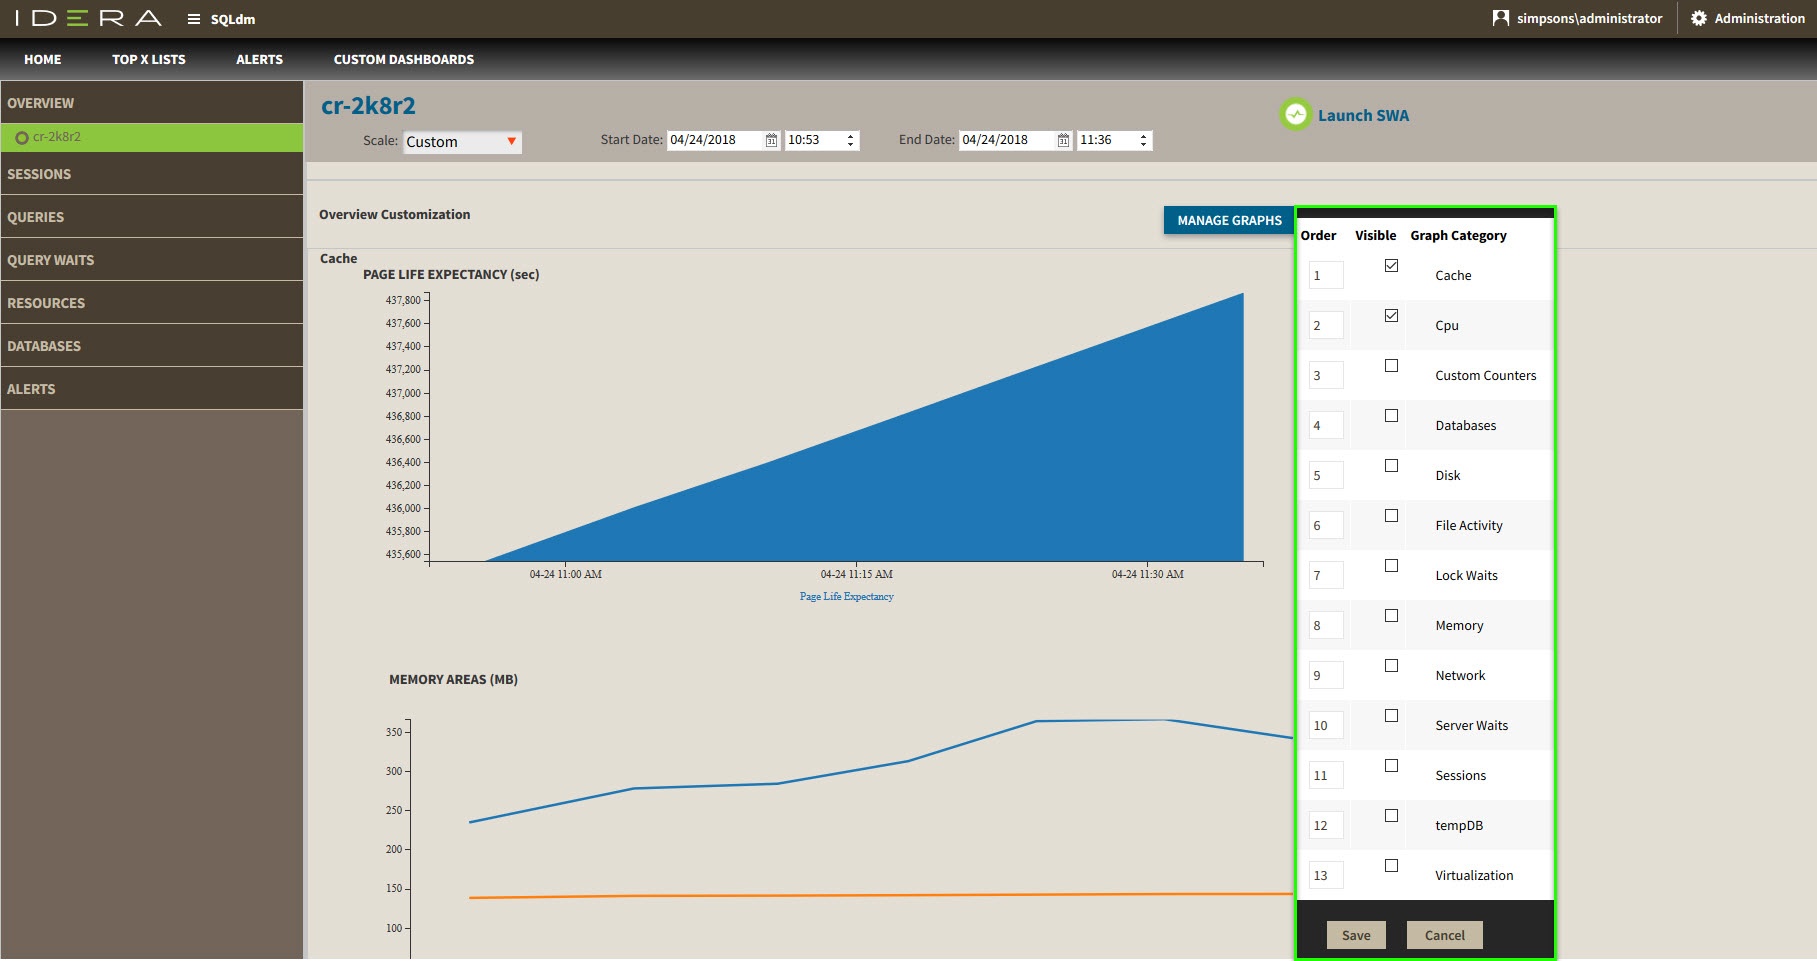
Cache
The Cache chart tracks the database and procedure processes using a buffer pool of memory on your monitored SQL Server instance.
CPU
The CPU chart tracks the performance of the processor used by your monitored SQL Server.
Custom Counters
The Custom Counters chart displays the statistics for a selected custom counter on a monitored SQL Server instance.
Databases
The Databases chart tracks the performance of the databases on your monitored SQL Server.
Disk
The Disk chart tracks the performance of the disk used by your monitored SQL Server.
File Activity
The File Activity chart displays the top five database files with the highest relative activity since the last refresh.
Lock Waits
The Lock Waits chart tracks the total number waits caused when a task is waiting to acquire a lock on your monitored SQL Server.
Memory
The Memory chart tracks the usage and availability of memory on your monitored SQL Server computer.
Network
The Network chart tracks the performance of the network connection being used by your monitored SQL Server.
Server Waits
The Server Waits chart tracks the total number and time spent on waits affecting your monitored SQL Server.
Sessions
The Sessions chart tracks the performance of the active and blocked sessions running on your monitored SQL Server.
tempDB
The Tempdb chart tracks the status of the tempdb database on your monitored SQL Server instance.
Virtualization
The Virtualization chart tracks the performance of your virtual machine or host, depending on the selection in the panel.
Anchor Categoviews Categoviews
Category views
| Categoviews | |
| Categoviews |
The single instance dashboard contains the Overview, Sessions, Queries, Query Waits, Resources, Databases, and Alerts tabs where you can see metrics and information on these category views.
![]()

From these tabs you can:
- View your SQL Server sessions information in IDERA Dashboard.
- View your SQL Server queries information.
- View your SQL Server query waits information.
- View your SQL Server resources information.
- View your SQL Server databases information.
- View your SQL Server alerts.
Access the single instance dashboard
SQL Diagnostic Manager provides several paths to access the single instance dashboard. The first access path is by clicking the appropriate monitored SQL Server instance in the list, thumbnail, or heatmap sub-views. The second access path is by clicking a specific instance from the Active Alerts panel, or the Most Critical Instances view in the main dashboard. It is also possible to access the single instance dashboard by clicking a specific instance or database in the Top servers by alert count, Top servers by response time, and Top databases by alerts widgets.
| Scroll pdf ignore | |||||||||||||||||||||||||||||||||||||||||||||||||||||||||
|---|---|---|---|---|---|---|---|---|---|---|---|---|---|---|---|---|---|---|---|---|---|---|---|---|---|---|---|---|---|---|---|---|---|---|---|---|---|---|---|---|---|---|---|---|---|---|---|---|---|---|---|---|---|---|---|---|---|
SQL SQLDiagnostic Manageridentifies and resolves SQL Server performance problems before they happen. Learn more > >for SQL Server performance monitoring, alerting, and diagnostics for SQL Server. Newtabfooter |
Newtabfooter |
Newtabfooter |
Newtabfooter |
Newtabfooter |
Newtabfooter |
Newtabfooter |
| ||||||||||||||||||||||||||||||||||||||||||||||||||
| Newtabfooter | |||||||||||||||||||||||||||||||||||||||||||||||||||||||||
| IDERA Website | Products | Purchase | Support | Community | About Us | Resources | Legal