The list view displays all matching objects for the view selection and grouping in the Main Query view. The following list options are available:
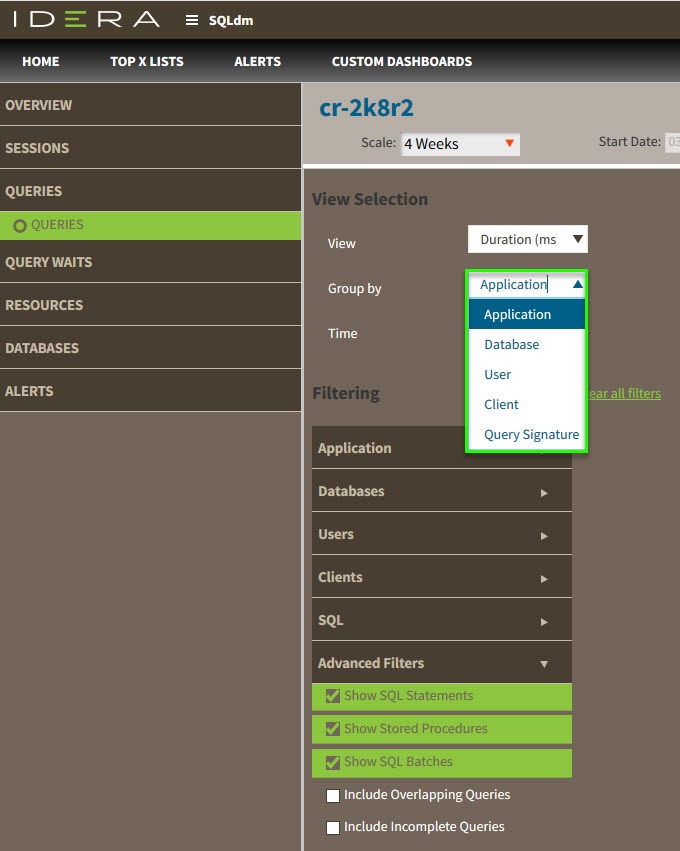 Image Added
Application list
...
The application list displays data that results from grouping by Application in the View Selection of the Main Query view. The application list provides you with the following information by default:
...
| Panel |
|---|
| borderColor | black |
|---|
| borderWidth | 1 |
|---|
| borderStyle | dashed |
|---|
| title | Explanation: CPU as % of List | borderStyle | dashed |
|---|
|
In the Main Query view, after selecting the CPU Time (ms) by Application view. The CPU as % of list metric provides the CPU as a percentage of the values returned in the application list. For example, if you have three applications returned with a total CPU Time (ms) of 600, then the CPU as % of list metric for each is calculated as follows:
Application 1- CPU Time (ms): 100; (100/600) *100 = 16.7% of total application CPU.
Application 2- CPU Time (ms): 200; (200/600) *100 = 33% of total application CPU.
Application 3- CPU Time (ms): 300; (300/600) *100 = 50% of total application CPU. The CPU as % of list metric helps to pinpoint which application in your list has the highest CPU Time percentage (Application 3).
|
...
Database list
 Image Removed
The database list displays data that results from grouping by Database in the View Selection of the Main Query view. The database list provides you with the following information by default:
...
User list
 Image Removed
The user list displays data that results from grouping by the user in the View Selection of the Main Query view. The user list provides you with the following information by default:
...
Client list
...
The client list is the data displayed after you selected Group By Clients in the View Selection of the Main Query view. The client list provides you with the following information by default:
...
Query Signature list
 Image Removed
The Query signature list is the data displayed after you selected Group By Query Signature in the View Selection of the Main Query view. The Query signature list provides you with the following information by default:
...
To research for additional query details, you can perform the following actions from this list:
| Tip |
|---|
title | Records| Note |
|---|
| You can display the top 100, 200, or all records by clicking the different Show Top options. |
| Scroll pdf ignore |
|---|
| Newtabfooter |
|---|
| alias | IDERA |
|---|
| url | http://www.idera.com |
|---|
|
| | Newtabfooter |
|---|
| alias | Products |
|---|
| url | https://www.idera.com/productssolutions/sqlserver |
|---|
|
| | Newtabfooter |
|---|
| alias | Purchase |
|---|
| url | https://www.idera.com/buynow/onlinestore |
|---|
|
| | Newtabfooter |
|---|
| alias | Support |
|---|
| url | https://idera.secure.force.com/ |
|---|
|
| | Newtabfooter |
|---|
| alias | Community |
|---|
| url | http://community.idera.com |
|---|
|
| | Newtabfooter |
|---|
| alias | Resources |
|---|
| url | http://www.idera.com/resourcecentral |
|---|
|
| | Newtabfooter |
|---|
| alias | About Us |
|---|
| url | http://www.idera.com/about/aboutus |
|---|
|
| | Newtabfooter |
|---|
| alias | Legal |
|---|
| url | https://www.idera.com/legal/termsofuse |
|---|
|
SQL Diagnostic Manager identifies and resolves SQL Server performance problems before they happen. Learn more > > | IDERA Website | Products | Purchase | Support | Community | About Us | Resources | Legal
|---|