Page History
The SQLDM web IDERA Dashboard console interface boasts an easy-to-navigate dashboard comprised of several views, sub-views, tabs, and widgets that provide a complete synopsis of your SQL Diagnostic Manager environment. Click the image to view the full size.

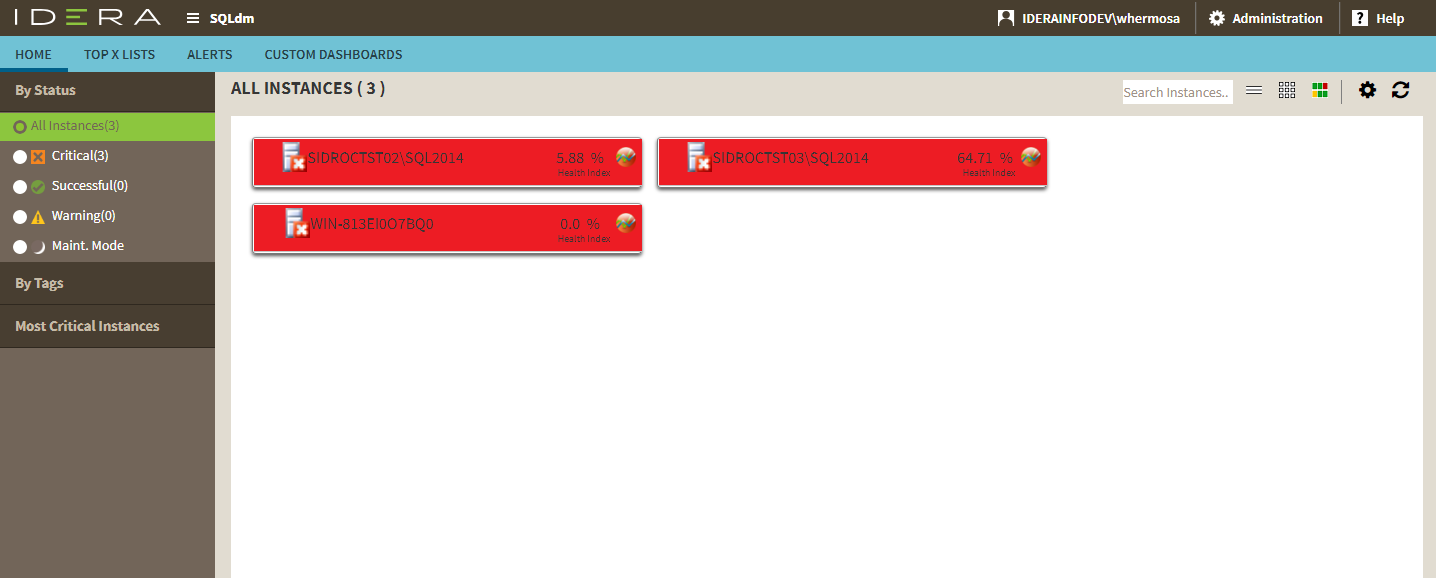
On the dashboard you can find the following sections:
- Views by Status, Tags, or Critical Instances
- List, thumbnail and heatmap sub-views
- Active alerts roll up view
- Top servers by alert count and response time widgets
- Top databases by alerts
- Top alert categoriesTop X Lists tab
- Alerts tab
- Custom Dashboards tab
Additional options
Search
In the SQL Diagnostic Manager web console IDERA dashboard, you can search for a particular instance by name. Use the percent (%) wildcard character if you do not remember the full name of the instance that you are looking for.
Heatmap Calculation Configuration
The  icon, located next to the search instances option, allows you to configure the scale factors to calculate the health index displayed in the heatmap.
Group by
In the SQL Diagnostic Manager web console dashboard, you can group returned information from the different views by SQLDM Repository.
Refresh
The Refresh button allows you to manually refresh displayed data.
...
In the SQL Diagnostic Manager web console dashboard, you can collapse either or both side panels to use all available screen space for the center panel.
| Scroll pdf ignore | |||||||||||||||||||||||||||||||||||||||||||||||||||||||||
|---|---|---|---|---|---|---|---|---|---|---|---|---|---|---|---|---|---|---|---|---|---|---|---|---|---|---|---|---|---|---|---|---|---|---|---|---|---|---|---|---|---|---|---|---|---|---|---|---|---|---|---|---|---|---|---|---|---|
Newtabfooter |
Newtabfooter |
Newtabfooter |
Newtabfooter |
Newtabfooter |
Newtabfooter |
Newtabfooter |
| ||||||||||||||||||||||||||||||||||||||||||||||||||
| Newtabfooter | |||||||||||||||||||||||||||||||||||||||||||||||||||||||||
| IDERA Website | Products | Purchase | Support | Community | About Us | Resources | Legal