Page History
...
In general, launching a tab from the All row, focuses on the Tier entity, which summarizes the data collected for all instances. Tabs that do not have an Tier entity, open on the default instance.
See About Precise for Sybase tabs on page 15, About the Current tab on page 40, About Precise for Sybase tabs on page 15, About the Activity tab on page 48, About the Statistics tab on page 82, and About the SQL tab on page 99.
| Anchor | ||||
|---|---|---|---|---|
|
...
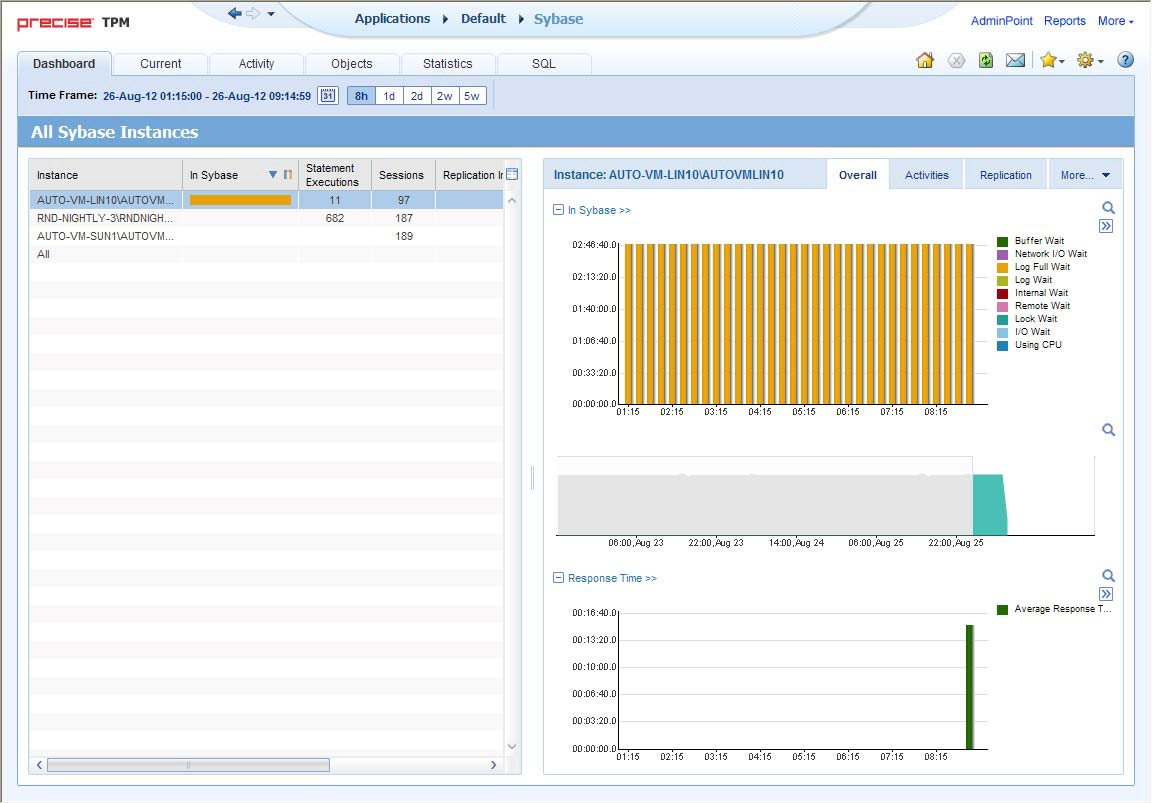
The figure below shows the structure of the Dashboard tab.
Figure 4- 1 Dashboard tab structure
About the Main area in the Dashboard tab
...
The table below shows the information displayed in the Instance table.
Table 4- 1 Instance table
| Column | Description |
|---|---|
| Instance | Name of the instance. |
| In Sybase | Breakdown of In Sybase duration of the instance during the selected time frame. |
| Statement Executions | Total statement executions during the selected time frame. |
| Sessions | Total number of sessions during the selected time frame. |
| Replication in Sybase | Total in Sybase resulting from the replication program in the selected time frame. |
| RepAgent Cmds | Number of Commands sent to replication by the selected ASE in the selected time frame. |
| Outbound Backlog | Number of commands delayed in the outbound processing phase in the selected time frame. This column is calculated as follows: sum (SQMR Cmds Read - SQM Cmds Written). |
About the Instance Details area in the Dashboard tab
...
All items in this display launch the Activity tab with an instance or Precise for Sybase Tier context. The table below describes the information displayed in the Overall tab.
Table 4- 2 General instance data
| General Instance Data | Description |
|---|---|
| In Sybase | Displays a breakdown of the total In Sybase duration over time, for the selected instance during the selected time frame, into states such as, Using CPU, I/O Wait, Lock Wait, and so on. |
| Load | Displays the total number of sessions over time, for the selected instance during the selected time frame. |
| Response Time | Displays the average response time over time, for the selected instance during the selected time frame. |
Observing top resource-consuming databases, programs and batches
...
All entities in this display launch the Activity tab, in-context of an instance or Tier. The table below describes the information displayed in the Databases table.
Table 4- 3 Databases table
| Column | Description |
|---|---|
| Database | Displays the names of the top resource-consuming databases. |
| Sessions | Displays the total number of sessions opened, during the selected time frame. |
| In Sybase | Displays the resource consumption of the database broken down into states such as, Using CPU, I/O Wait, and Lock Wait states. Click the respective icons to display the data in this column in a stacked graph or numerical format. |
The table below describes the information displayed in the Programs table.
Table 4-4 Programs table
| Column | Description |
|---|---|
| Program | Displays the names of the top resource-consuming programs. |
| Sessions | Displays the total number of sessions opened, during the selected time frame. |
| In Sybase | Displays the resource consumption of the program broken down into states such as, Using CPU, I/O Wait, and Lock Wait states. Click the respective icons to display the data in this column in a stacked graph or numerical format. |
The table below describes the information displayed in the Batches table.
Table 4- 5 CMDBatches table
| Column | Description |
|---|---|
| Batch | Displays the IDs of the top resource-consuming batches. |
| Duration (Avg) | Displays the average duration of the batch, during the selected time frame. |
| In Sybase | Displays the resource consumption of the database broken down into states such as, Using CPU, I/O Wait, and Lock Wait states. Click the respective icons to display the data in this column in a stacked graph or numerical format. |
Examining Replication for an instance
...
The table below describes the information displayed in the Replication tab.
Table 4- 6 Replication graphs
| Statistical Data | Description |
|---|---|
| Total In_Sybase vs. Replication activity (outbound) | Displays the total In_Sybase of the instance versus the In_Sybase resulting from replication activity in the selected time frame. The In_Sybase resulting from replication activity is displayed as a stack bar which represents the various states. This graph can give an indication of how much the replication activity is taking out of the entire instance activity. In addition, you can see a change in the activity trend. You can click on the graph title to launch to the Activity tab to see more details regarding the activity resulting from replication. |
| Outbound Load | Displays counters related to outbound processing that can indicate latency in one of the outbound components during the selected time frame. The following counters are displayed in this graph:
Clicking the graph title launches the Statistics tab, allowing further investigation. |
| Inbound Load | Displays the number of commands sent by the selected ASE for replication during the selected time frame.
Clicking the graph title launches the Statistics tab, allowing further investigation. |
Examining statistics for an instance
...
All items in this display launch the Statistics tab with an Instance or Precise for Sybase Tier context. The table below describes the information displayed in the Statistics tab.
Table 4- 7 Instance statistics
| Statistical Data | Description |
|---|---|
| Engine utilization | Displays the Engine utilization for the selected instance during the selected time frame. |
| Committed transactions | Displays the number of committed transactions during the selected time frame. |
| Connections opened | Displays number of connections opened during the selected time frame. |
Observing top resource-consuming entities
...
The table below describes the information displayed in the Machines table.
Table 4- 8 Machines table
| Column | Description |
|---|---|
| Machine | The names of the top resource-consuming machines. |
| Sessions | Total number of sessions opened during the selected time frame. |
| In Sybase | The resource consumption of the machine broken down into states such as, Using CPU, I/O Wait, and Lock Wait states. Click the respective icons to display the data in this column in a stacked graph or numerical format. |
The table below describes the information displayed in the Logins table.
Table 4- 9 Logins table
| Column | Description |
|---|---|
| Login | The names of the top resource-consuming logins. |
| Sessions | Total number of sessions opened during the selected time frame. |
| In Sybase | The resource consumption of the login, broken down into states such as, Using CPU, I/O Wait, and Lock Wait states. Click the respective icons to display the data in this column in a stacked graph or numerical format. |
The table below describes the information displayed in the Users table.
Table 4- 10 Users table
| Column | Description |
|---|---|
| User | The names of the top resource-consuming users. |
| Sessions | Total number of sessions opened during the selected time frame. |
| In Sybase | The resource consumption of the user, broken down into states such as, Using CPU, I/O Wait, and Lock Wait states. Click the respective icons to display the data in this column in a stacked graph or numerical format. |
Observing your system's current activity
The Current tab displays the overall activity and active sessions that occurred within the last minute for the selected instance. All items in this display launch the Current tab, in the context of an instance. The table below describes the information displayed in the Sessions Activity area.
Table 4- 11 Sessions activity
| Item | Description |
|---|---|
| Sessions | Total number of sessions connected to the selected instance. |
| Active Sessions | Total number of sessions currently active. |
| Locked Sessions | Total number of locked sessions. |
The table below describes the information displayed in the Current Activity graphs
Table 4- 12 Current activity graphs
| Item | Description |
|---|---|
| Overall Activity (Last Minute) | Provides a graphical display of the overall activity that occurred within the last minute, for the selected instance, broken down into the following states: Waitfor command, Synchronized Wait, Other Wait, Request Wait and In Sybase. |
| In Sybase (Last Minute) | Provides a graphical display of In Sybase activity that occurred within the last minute, for the selected instance, broken down into states, such as, Using CPU, I/O Wait, and Lock Wait. |
The table below displays a list of all the active sessions that occurred within the last minute, for the selected instance.
Table 4- 13 Active sessions (Last minute)
| Item | Description |
|---|---|
| Icon | Represents the current session's state (such as, Lock Wait, Request Wait). |
| SPID | The session ID. |
| Program | The name of the program that opened the session. |
| State In Sybase | The current state of the session. Total In Sybase entities for the session, occurring within the last minute, broken down into states (such as, Using CPU, I/O Wait, and Lock Wait). |
| Anchor | ||||
|---|---|---|---|---|
|
...
- Select the Current tab in the Instance Details area to view all the active sessions and an In Sybase breakdown into states, such as, Using CPU, I/O Wait, and Lock Wait.
- Launch the Current tab to view additional information on the current sessions.
...
| Newtabfooter |
Newtabfooter |
Newtabfooter |
Newtabfooter |
Newtabfooter |
| |||||||||||||||||||||||||||||||
| Newtabfooter | ||||||||||||||||||||||||||||||||||||
|---|---|---|---|---|---|---|---|---|---|---|---|---|---|---|---|---|---|---|---|---|---|---|---|---|---|---|---|---|---|---|---|---|---|---|---|---|
|
Precise. Performance intelligence from click to storage. Learn more > >
...