Page History
...
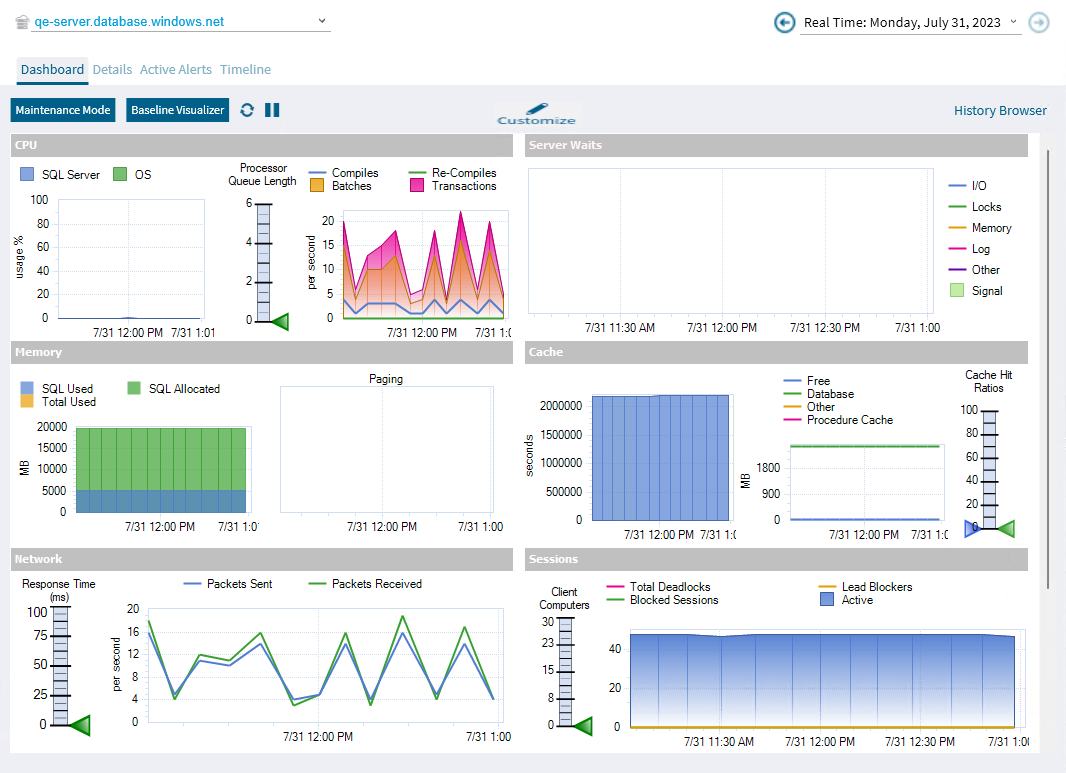
- CPU
- Server Waits
- Memory
- Cache
- Network
- Sessions
- SQL Server Physical I/O
- Databases
You can add or edit the layout of your Dashboard by clicking Customize. In the Customize Dashboard screen, click View Panel Gallery, and drag the panels from the right side to your Dashboard screen on the left.

Details
The Details screen shows the properties of the monitored Azure SQL server, including the Version, Edition, Host OS, Databases, and Log Size. On the right screen, you can review the metrics list, and check any metric to add it in the chart located at the bottom of the screen.
...
The Timeline view provides a chronological chart of events that affect your monitored SQL Server instance. The view details the point in time for this monitored SQL Server instance when an alert occurred, including custom counter alerts.