Page History
Active Queries View
The Active Queries view provides relevant information about active queries on your environment. The available information consists of You can find the following information:
- Account / User Name that started a query
...
- Session SPID
- Query's command text
...
- Start and end time of the query
...
- Elapsed time in milliseconds
...
- CPU Time
...
- Reads and writes in kb.
you can change the settings of Query activity data collection on the Active Query Configuration screen. to open the configuration window click Configuration
Configuring Active Queries view
In the Active Queries view, the Configurtion To change the settings of how query activity data collection the In the Active Queries configuration you can perform the following actions:
You can configure Query Monitoring to collect data constantly or collect data at collection time only, collect data on all queries or collect data on poorly performing queries only, set the location of log files, and set time periods for historical data retention.
The Active queries screen provides information about queries collects query activity data constantly, you can change this setting
By default IDERA SQL Business Intelligence Manager monitors queries constantly, you can change this setting on the configuration section, other settings available in the configuration section are collection of poorly performing queries, set the location of log files, and set time periods for data retention.
The Active Queries screen provides information about query activity, the information is collected constantly, you can disable this on the configuration window.
To configure Query monitoring settings click Configure in the Active Queries view.
By default IDERA SQL Business Intelligence Manager v2.2 monitors queries constantly, you can change this setting on the configuration window
To change the query monitoring settings, click Configure in the Active Queries view.
The application will need to provide the ability to configure constant collection for queries, with the option to collect on long running queries, and save them for a specified period of time.
SQL Business Intelligence Manager identifies issues within the SQL BI environment to help optimize BI service performance. Learn more >>
Configuring the Active Queries view
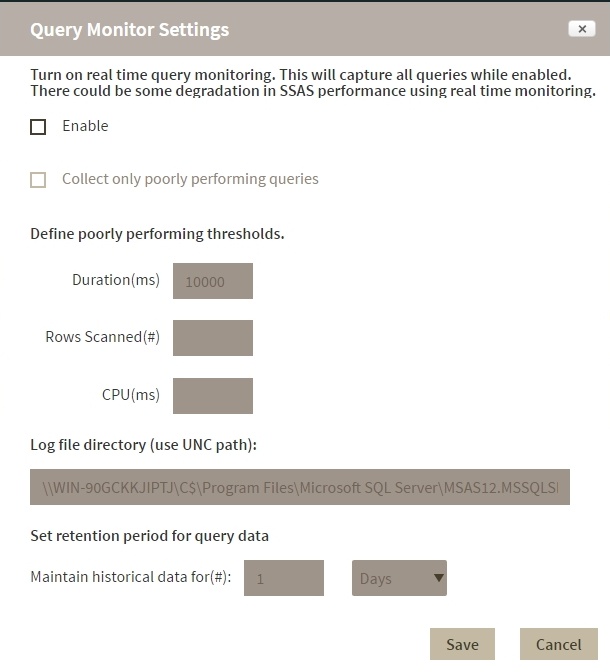
To change the query activity data collection settings, click Configuration on the Active Queries screen. On the configuration screen you can change the following settings:
- Enable real time query monitoring.
- Collect data from all queries or from poorly performing queries only.
- Set the location of log files.
- Set time periods for historical data retention.
Real time Query monitoring
Use the Enable option to turn on or turn off this feature.
Enabled: SQL BI Manager collects query data constantly. While query monitoring has minimal overhead, SSAS performance could be affected.
Disabled: The instances refresh interval determines how often query data is collected. (set under Manage Monitored Services )
Poorly performing queries
| Info |
|---|
To use these settings you must enable real time query monitoring. |
When you enable this option SQL BI Manager collects information only when queries cross one or more of these thresholds:
| Duration in milliseconds | Time in milliseconds after which a query is considered poorly performing. |
| CPU time in milliseconds | How much CPU time a query uses. |
| Rows Scanned in #rows | The number of rows a query reads. |
Retention period
This setting determines for how long SQL BI Manager retains historical data, the default retention period is one day. To set a time period type a number in the first field and select a value from the dropdown (min, hours, days, weeks, months). Depending on query activity, longer retention periods will cause the repository database to grow significantly
Location of log files
This is the path where IDERA SQL BIM stores log files, the default path is the same as the SSAS log files location. to set another path use the UNC format, for example,\\<server name>\c$\Program Files\Microsoft SQL Server\MSAS12.MSSQLSERVER\OLAP\Log. Make sure that the account used for data collection has permissions for accessing and writing to the log files directory.
...