Page History
SQL Diagnostic Manager allows you you to choose the type of custom report you want to create. You can select the show graphical datareport or theshow worst-performing servers for each metric report.

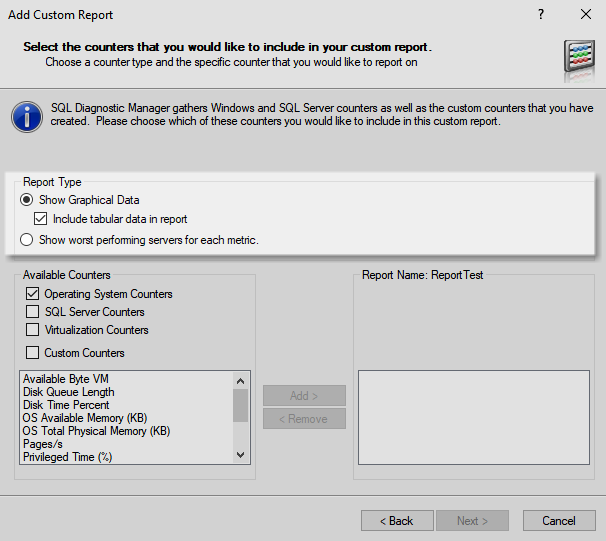
If you want SQL Diagnostic Manager to display tabular data, select the Include tabular data in the report check box.
| Tip |
|---|
Enable the Include tabular data in the report check box by clicking the Show Graphical Data radio button. |
| Scroll pdf ignore | |||||||||||||||||||||||||||||||||||||||||||||||||||||||||
|---|---|---|---|---|---|---|---|---|---|---|---|---|---|---|---|---|---|---|---|---|---|---|---|---|---|---|---|---|---|---|---|---|---|---|---|---|---|---|---|---|---|---|---|---|---|---|---|---|---|---|---|---|---|---|---|---|---|
Newtabfooter |
Newtabfooter |
Newtabfooter |
Newtabfooter |
Newtabfooter |
Newtabfooter |
Newtabfooter |
| ||||||||||||||||||||||||||||||||||||||||||||||||||
| Newtabfooter | |||||||||||||||||||||||||||||||||||||||||||||||||||||||||
| IDERA Website | Products | Purchase | Support | Community | About Us | Resources | Legal