Page History
SQL Server SQL Server Agent Log and SQL Server SQL Server Error Log metrics allow users to trigger an alert based on certain text or regular expressions. SQL Diagnostic Manager provides different levels of alerts so you can select whether you want to generate a critical, warning, or informational alert based on your entered data. You can also limit the size of your logs to decrease your response time and avoid using additional space on your server.
To use ad hoc Alert Configuration to enter text or a regular expression to trigger an alert:
- In the Navigation page, click Servers.
- Right-click the appropriate SQL server SQL Server instance, and then select Configure Alerts.
- Select the metric for which you want to configure an alert.
- Click Advanced.
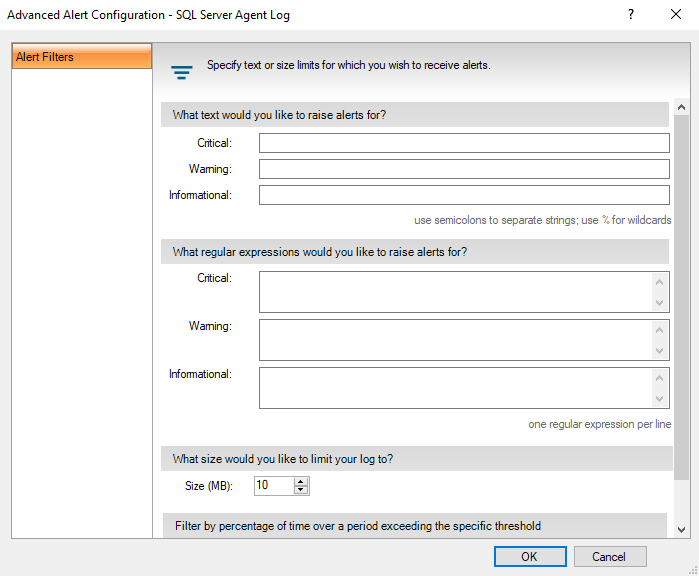
- If you want to trigger an alert for certain text, type Under What text would you like to raise alerts for? Type the text in the appropriate field. Use semicolons to separate names and a percent (%) character as a wildcard.
- If you want to trigger an alert for a certain regular expression, type Under What regular expressions would you like to raise alerts for? Type the expression in the appropriate field. Type only one regular expression per line.
- Click OK.To accept these changes, click OK.
To use Alert Configuration Templates to enter text or a regular expression to trigger an alert:
- Click Tools >
and select Alert Configuration Templates.
- Click New or select an existing template, and then click View/Edit.
- If you clicked New , type a name, and then click Edit Configuration.
- If you clicked View/Edit, click Edit Configuration.
- Select the metric for which you want to configure an alert.
- Click Advanced.
- If you want to trigger an alert for certain text, type Under What text would you like to raise alerts for? Type the text in the appropriate field. Use semicolons to separate names and a percent (%) character as a wildcard.
- If you want to trigger an alert for a certain regular expression, type Under What regular expressions would you like to raise alerts for? Type the expression in the appropriate field. Type only one regular expression per line.
- Click OK.
- If you want SQL Diagnostic Manager to replicate your edits to every monitored SQL Server instance, click Yes.
- To accept these changes, click OK.
Limit the size of a log that SQL Diagnostic Manager reads
In an attempt to improve response time and avoid using unnecessary space on your server, you can designate the maximum size of your SQL Server SQL Server Agent log and your SQL Server SQL Server Error log that SQL Diagnostic Manager reads. When a log reaches the size limit set in the Alert Configuration, it triggers an alert. SQL Diagnostic Manager does not display in the Logs view any data from error or agent logs in excess of the size limit. A quick solution to decrease the size of your file is to click Cycle Server Log to archive the information in the most recent log and start a new log. You can also cycle the log using SSMS.
| Tip |
|---|
Before cycling your log, it is important to note that if you have a limit set, then the log file deleted is the oldest log file stored. If you want to keep that log file, copy the file elsewhere before cycling the log. |
| Note |
|---|
SQL Server SQL Server 2000 users also must restart the SQL Server SQL Server Agent Service after cycling the SQL Server SQL Server Agent log. The only way to cycle the agent log on SQL Server SQL Server is to cycle the agent service. This process results in a new log. |
...
- View the Alert Configuration for your monitored SQL Server SQL Server instance.
- Select either the SQL Server SQL Server Agent Log or the SQL Server SQL Server Error Log alert, and then click Advanced.
- In the Alert Filters tab, adjust the Size (MB) field based on what you want for your log size limit.
- Click OK, and then click Apply.
- Click OK in the confirmation message if you want to apply your change to any other SQL Server SQL Server instances, or click No.