Page History
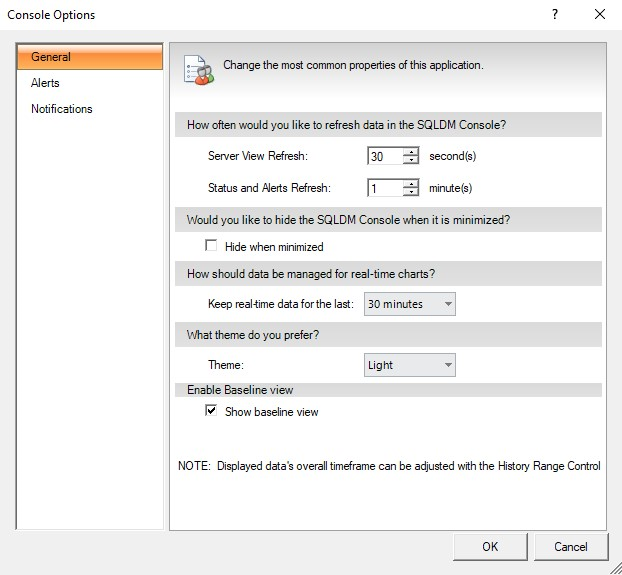
The options on the General tab represent the most common properties users can change in the SQL Diagnostic Manager Console.

Access the Console Options window General tab
You can open the General tab of the Console Options window from the SQL Diagnostic Manager Console by selecting Tools > Console Options. The General tab is available by default.
...
The Hide when minimized toggle determines whether SQL Diagnostic Manager displays as an active application in your Windows taskbar. When you want to open your SQL Diagnostic Manager Console again , double-click the IDERA SQL Diagnostic Manager icon in your taskbar. Enabling or disabling this option has no does not effect on data collection or the refresh rate of your currently active view.
...
Chart options allow you to determine how much data is kept in your real-time charts and select from the following options: 1 minute, 5 minutes, 10 minutes, 15 minutes, 30 minutes, 1 hour, 2 hours, 4 hours, 8 hours, 12 hours, and one day.
Use a
...
theme
The
...
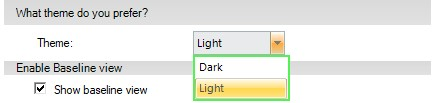
color theme field allows you to select the background color you prefer for the SQL Diagnostic Manager Management Console, select between Dark and Light. By default, the scheme is set to
...
Light.
Enable Baseline view
The Baseline view can be enabled and disabled by checking the "Show baseline view" box box.