Page History
The Profiling Details view displays detailed information on any item selected in the Top Section View, such as an SQL statement, an Event, a Session or a Procedure.
Depending on the data source platform you have specified, the tabs that appear in the view will be different, in order to accommodate the parameter specifics of the statement you have selected.
...
The SQL Text tab displays the full code of the SQL statement.
| Anchor | ||||
|---|---|---|---|---|
|
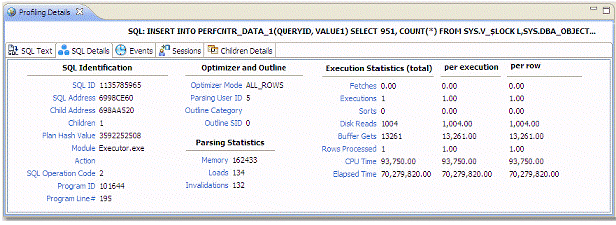
The SQL Details tab provides information and the execution of the statement and other information related to how it is running.
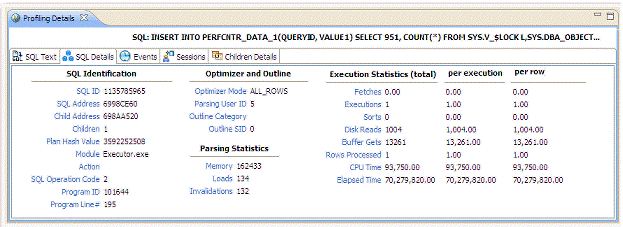
SQL Details include:
...
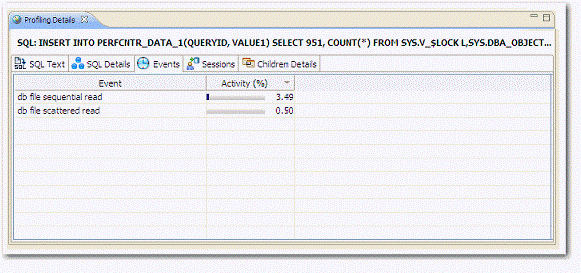
The Events tab provides details about the events that the statement is associated with.
| Anchor | ||||
|---|---|---|---|---|
|
The Sessions tab provides information about any sessions the statement is associated with:
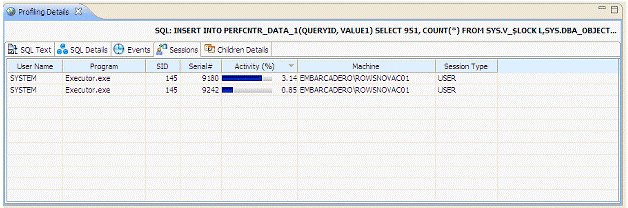
Session details include information on different parameters, such as User Name, Program, SID, Serial #, Activity (%), Network Machine Name, and Session Type.
...
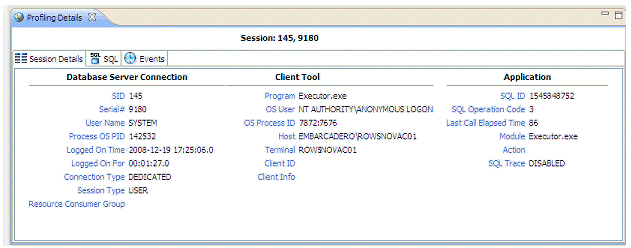
The Session tab provides further information about the selected session.
| Anchor | ||||
|---|---|---|---|---|
|
The SQL tab displays information about the statements associated with the session.
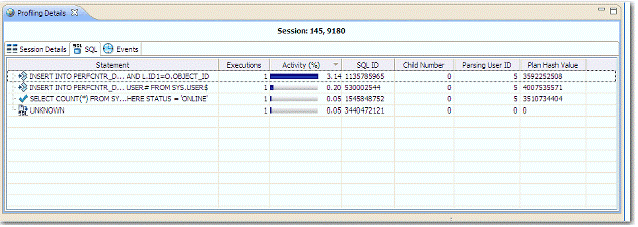
SQL statements are listed by the following parameters:
...
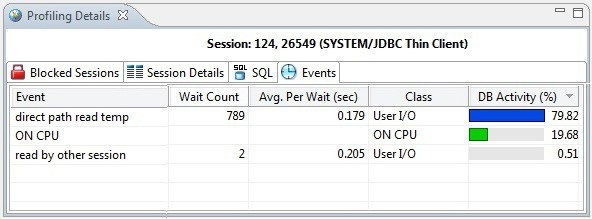
The Events tab provides details about the events that the session is associated with.
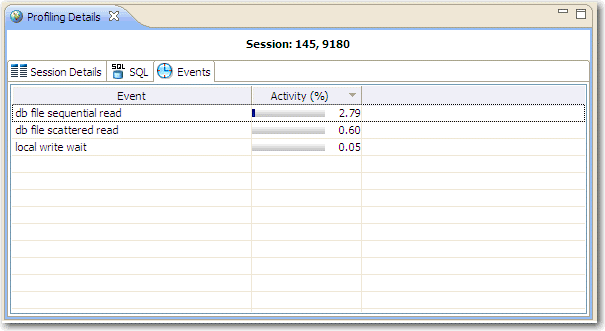
Events are listed by the following values:
...
Profiling captures the bind variables and their attributes. Select an SQL statement in the Profiling Session and the details of the captured bind variables for that statement are displayed here.
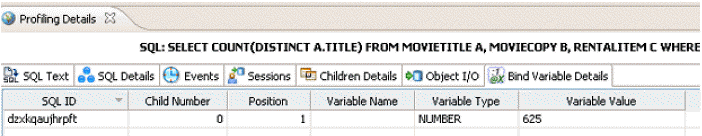
The following parameters are displayed on the Bind Variable Details tab:
...
The Blocked Sessions tab provides general information on blocked sessions and the details identifying the specific row locked.
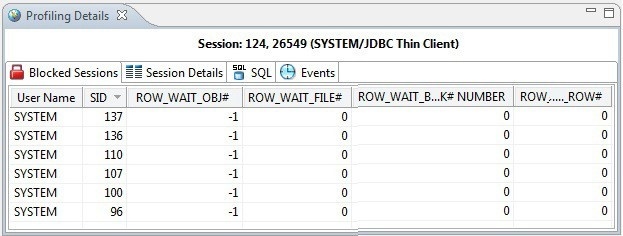
This tab provides the following columns for each blocked session:
...
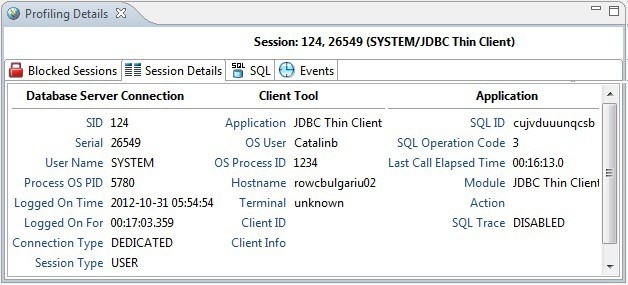
The Session Details tab provides information on the server connection, client, and application associated with the blocking session.
SQL
The SQL tab displays information about the statements associated with the blocking session.
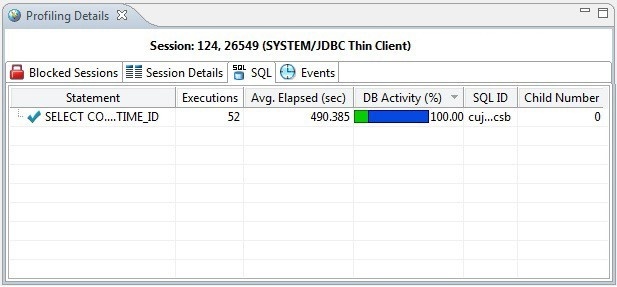
SQL statements are listed by the following parameters:
...
The Events tab provides details about the events that the blocking session is associated with.
Events are listed by the following values:
...
The SQL tab displays information about the SQL statements involved in the selected event.
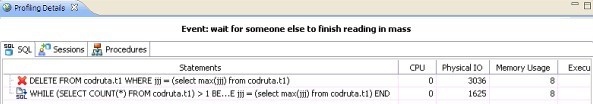
| Value | Notes |
|---|---|
| Statement | The name of the statement. |
| SQL ID | The ID value of the SQL statement. |
| Child Number | The child number in the database. |
| Parsing User ID | The ID of the user who parsed the statement. |
| Plan Hash Value | The execution value of the statement. |
| CPU | Cumulative CPU time for the process. (measured in "ticks", an arbitrary unit of time) |
| Physical IO | Cumulative disk reads and writes for the process. (total count) |
| Memory Usage | Number of pages in the procedure cache that are currently allocated to this process. A negative number indicates that the process is freeing memory allocated by another process. |
| Executions | The number of times the statement was executed. |
| Activity (%) | A graphical representation of the distribution of execution and wait time for the statement or statement component. |
...
You can kill a session by right-clicking the entry on the Sessions tab and choosing Kill Session. You can start a trace on a session by right-clicking the entry on the Sessions tab, and then choosing Trace. For more information, see Killing an Oracle Session and Tracing an Oracle Session.