Page History
...
The table below describes which tasks can be performed in each tab.
Table 2- 1 Precise for Sybase tabs
| Tab | Description |
|---|---|
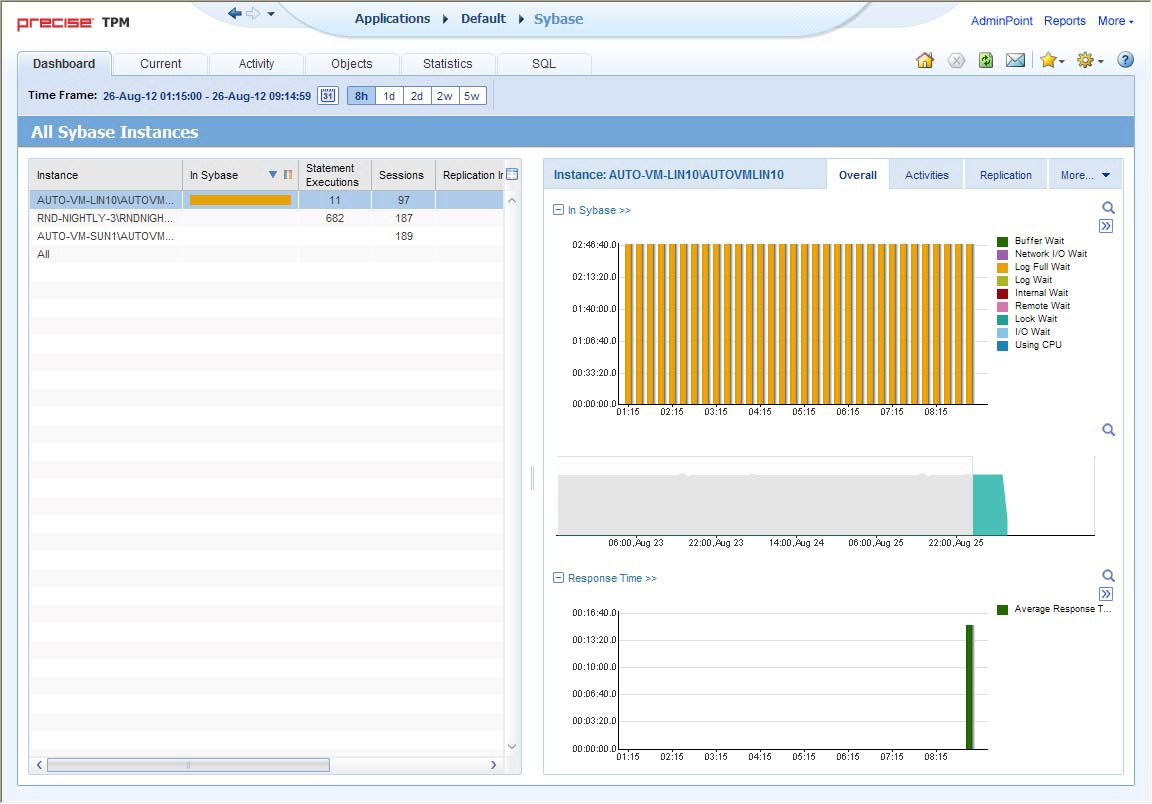
| Dashboard | Allows you to quickly identify which Sybase instance has a performance problem, providing the first glimpse into where the problem lies. |
| Current | Allows you to solve the performance problems that are happening now. |
| Activity | Allows you to examine the application's performance over time and helps locate performance bottlenecks in its behavior. |
| Objects | Allows you to identify which Sybase tables are used inefficiently by the application, and their effect on the application components. |
| Statistics | Allows you to identify performance bottlenecks in the way Sybase instance resources are used. |
| SQL | Allows you to tune problematic SQL statements. |
| Anchor | ||||
|---|---|---|---|---|
|
...
The following figure provides a description of the common key elements in the Current tab and what happens when you drill down to a specific entity.
Figure 2- 1 How a typical tab is structured
About the Precise bar
The Precise bar enables you to keep track of where you have been and provides various controls. The table below describes the function of each of the toolbar buttons.
Table 2-2 Precise bar functions
| Icon | Name | Description |
|---|---|---|
 | Back | During a work session, keeps track of where you have navigated to. The Back and History buttons enable you to navigate between previously visited views. The Back control displays your previous view. |
 | Forward | Enables you to navigate to the next view. This button is only enabled if you clicked Back or if you chose a history option. |
 | AdminPoint | Launches Precise AdminPoint. |
 | Home | Navigates to the highest level entity, usually the instance or Tier (all instances). The time frame settings remain the same. |
 | Stop | Stops a request for information from the server. |
 | Refresh | Updates the data currently displayed. |
 | Favorites | Enables you to add or remove favorites in your Favorites list. |
 | Send | Opens a new email message in your email program with the link to the current application in context. |
 | Settings | Opens the General Settings, Transactions & Users Settings, and Time Frame Settings dialog boxes. |
| Help | Help | Opens the online help in context. |
| Anchor | ||||
|---|---|---|---|---|
|
The Main area displays general information on the selected entity. The structure of this area depends on the selected entity and tab.
...
In some tabs, you can filter the contents of the view by clicking the Filter button. See Filtering data on page 21.
| Anchor | ||||
|---|---|---|---|---|
|
The Association area lists entities that have similar attributes and that are related to the selected entity named in the Tab heading. Besides the Tab bar, the Association area is the main navigation tool. It enables you to drill down from one entity to related entities (usually of a different type).
...
The Association control, accessed by the arrow icon, allows you to associate with different entities. The last option, More..., opens a dialog box that lets you carry out additional operations, such as to view additional associations, change the sort order, or control the number of returned rows.
...
 Displays the information in percentage format.
The Association area enables you to drill down to another entity by clicking a row. The information displayed in both the Main area and the Association area will change to reflect your selection. See Filtering data on page 21 and and Associating entities with data that meet specific criteria on page 21.
| Anchor | ||||
|---|---|---|---|---|
|
...
- Number of items that will be displayed for each association. From the list, select the maximum number of items that will be displayed in a table. The default is 50 items. You can control the number of items returned for a specific association by using the More... option option in the Association controls. This way, you can display up to 500 items.
- Maximum number of characters to display in a text ToolTip. When you move your cursor over text columns in a table listing Statements or PL/SQLs, a ToolTip appears, displaying more text than can normally fit into a table cell. This field controls the maximum number of characters that can be displayed. The default is 500 characters.
- How often the information in the Current tab is refreshed. If you select the Auto-refresh Current tab every check box, the Current tab automatically refreshes at the specified interval. By default, the tab is not refreshed automatically. If you select this option, the default refresh interval is every five minutes.
...
Selecting a predefined time frame from the toolbar displays transaction performance data for the selected time period up to the current time. See Selecting a predefined time frame from the Precise for Sybase toolbar on page 20.
Selecting the time frame using the calendar icon, you can choose to define a time range independent of the current time, or to define a time range up to the current time. See Selecting a time frame using the calendar icon on page 20. The predefined time frame options are:
...
The time frame selected affects all information displayed in Precise for Sybase. Only data that falls within the selected time frame is shown in these areas.
| Anchor | ||||
|---|---|---|---|---|
|
To select a predefined time frame, from the Precise for Sybase toolbar, select one of the predefined time frames.
| Anchor | ||||
|---|---|---|---|---|
|
To select a time frame
- Click the calendar icon. In the dialog box that is displayed perform one of the following:
- To define a time frame independent from the current time, select the ‘Time Range’ option and Time Range, and then select the Start and End dates and times.
- To define a time frame up to the current time, select the ‘Last’ option Last, and then enter the desired time frame.
- To use one of the three previously used time frames, select the ‘Recently used’ option and from the drop- down menu Recently used, and then select the desired time frame.
- To use a previously saved time frame, select Use a previously saved time frame and from the drop-down menu , and then select the desired time frame.
- To save your settings for future access, select Save these definitions for future use as:, and then enter a name in the corresponding field.
- Click OK.
...
You can send an email message to one or more recipients from the Precise toolbar. The default subject for the message will be “Link is, "Link to a Precise application”application."
The email will include a link to the Precise product in the current context (time frame and selected entries).
...
For more information on configuring permissions and roles, see the Precise Administration Guide.
| Anchor | ||||
|---|---|---|---|---|
|
...
The table below describes the duration value for each type of entity.
Table 2- 3 Duration values for entities
| Entity | Description |
|---|---|
| Current Session | The time that has elapsed since the session started (login time). This is not the time the session was active executing statements. For example, if a session was connected to Sybase for one hour without executing any statement, the duration will still be one hour. |
| Programs (Logins, Machines, DB Users, Databases, Time Units, and so on.) | The elapsed time of the sessions executing the program. The time is not measured from the login time (as it is in the Current session entity), but from the moment the Collector agent started. The average duration counter displays the average time each program has been running. |
| Statement (batch) | The time that elapsed while the statement was executed. This is very similar to the duration of programs (see above); but since the statement is almost always active, this duration also indicates the time the statement was active. The average duration counter displays the average execution time of the statement. |
| Anchor | ||||
|---|---|---|---|---|
|
Sybase provides reporting on many different types of events. Precise for Sybase groups events according to logical relationships to enable you to easily pinpoint heavy resource consumers.
...
The In Sybase session states signify that the session is performing activities in Sybase. The table below describes the In Sybase session states.
Table 2- 4 In Sybase session states
| Icon | In Sybase State | Description |
|---|---|---|
 | Using CPU | The session is currently executing and is not waiting for any other event. For versions lower than version 12.5.0.3, the Using CPU state is usually identified by sysprocesses status = Runnable/Running. For version 12.5.0.3 and higher, this state is identified by the monProcess WaitEventID field containing a value in Wait Class 1 (waiting to be scheduled). Usually this state is an ideal state, but verify that the amount of CPU usage is reasonable compared to the transaction being performed. In addition monitor this state over time and verify that a growth in the CPU usage is a result of a growth in load and not a result of any change that caused the performance to degrade. |
 | I/O Wait | This state indicates the session is waiting for an I/O operation to terminate. For versions lower than version 12.5.0.3, this state is usually identified by sysprocesses status = sleeping, unless the cmd field = COMMIT/ROLLBACK/LOG SUSPEND. For version 12.5.0.3 and higher, this state is identified by the monProcess WaitEventID field containing a value in Wait Classes 2 or 3 (waiting for a disk read / write to complete). |
 | Lock Wait | The session is waiting for a lock to be released. The lock is held by another session. For versions lower than version 12.5.0.3, this state is identified by |
 | Log Full Wait | The session is waiting for an operation of the log file to terminate. This state is generally encountered during a transaction log full. For versions lower than version 12.5.0.3, this state is identified by |
 | Log Wait | The session is waiting for an operation of the log file to terminate. This state is generally encountered during a commit or rollback operation. For versions lower than version 12.5.0.3, this state is identified by |
 | Buffer Wait | The session is waiting to access a user log cache. For versions lower than version 12.5.0.3, this state is identified by |
 | Latch Wait | The session is waiting for an internal lock to be released. Latches are short term light weight synchronization objects. Latches are not held for the duration of a transaction. Latches are used for datapage and datarow locking, including OAM and allocation pages, but not for allpages locking. They mostly occur in SMP applications. For versions lower than version 12.5.0.3, this state is identified by |
 | Remote Wait | The session is waiting for a remote query to terminate. For all versions, this state is identified by sysprocesses status = remote I/O. |
 | Network I/O Wait | The session is completing a network I/O operation. Network I/O occurs if results from a large result set are transferred to the client using shared memory netlibs or TCP/IP. For versions lower than version 12.5.0.3, this status is identified by a status of |
Understanding Non-In Sybase session states
The table below describes the Non-In Sybase session states.
Table 2- 5 Non-In Sybase session states
| Icon | State | Description |
|---|---|---|
 | Request Wait | The session is waiting for the client to issue a request. For versions lower than version 12.5.0.3, this state is identified by |
 | Other Wait | Sessions waiting in states not described here are assigned the Other wait state. |
 | Waitfor Command | The session is executing the WAITFOR DELAY command. For versions lower than version 12.5.0.3, this state is identified by |
 | Parallel Sync Wait | The session is waiting for a synchronization message from another process in the family. For versions lower than version 12.5.0.3, this state is identified by |
About Statement identifiers
...
This URL provides secure access to the StartPoint using authorized roles. From here, you can launch all Precise products. It gives you a quick overview of the status of your applications and access to the AdminPoint, where you can perform various management tasks (For more information, see the the Precise Administration Guide).
| Info |
|---|
You must have local administrator privileges on the server where the StartPoint is running. |
...
- Type the address of the StartPoint user interface into the Address bar of your browser and click Enter.
The Precise login page opens. The login page provides secure access to Precise and to your specific product. - Specify your authorized role name and password.
By default, both role name and password areadmin. For more information about role names, see the the Precise Administration Guide. - Click Login.
The StartPoint page opens. This is the Precise home page. - On the Product Selection bar, from the drop-down list, select the product you want to launch.
Precise. Performance intelligence from click to storage. Learn more > >
...