Page History
The Alerting option from the SQL Compliance Manager Menu allows users to configure their preferred email and SNMP settings, as well as to groom undesired alerts on your SQL Servers.
Available actions
Configure Email Settings
The Configure Email Settings window allows you to configure IDERA SQL Compliance Manager to connect to your mail server. This configuration is required to send alert email notifications. For more information, see Configure Email Settings window.
Configure SNMP Settings
The SNMP Configuration window allows you to specify the server address, port number, and community name of the network management console that you want to receive a IDERA SQL Compliance Manager alert notification as SNMP Trap messages. For more information, see SNMP Configuration window.
Groom Alerts Now
The Groom Alerts Now window allows you to groom alert messages currently stored in the Repository databases. Grooming permanently deletes any alert message that is older than the age limit you specify. For more information, see Groom Alerts Now window.
Available fields
Configure Email Settings
The Configure Email Settings window allows you to configure IDERA SQL Compliance Manager to connect to your mail server. This configuration is required to send alert email notifications. For more information, see Configure Email Settings window.
Configure SNMP Settings
The SNMP Configuration window allows you to specify the server address, port number, and community name of the network management console that you want to receive a IDERA SQL Compliance Manager alert notification as SNMP Trap messages. For more information, see SNMP Configuration window.
Groom Alerts Now
...
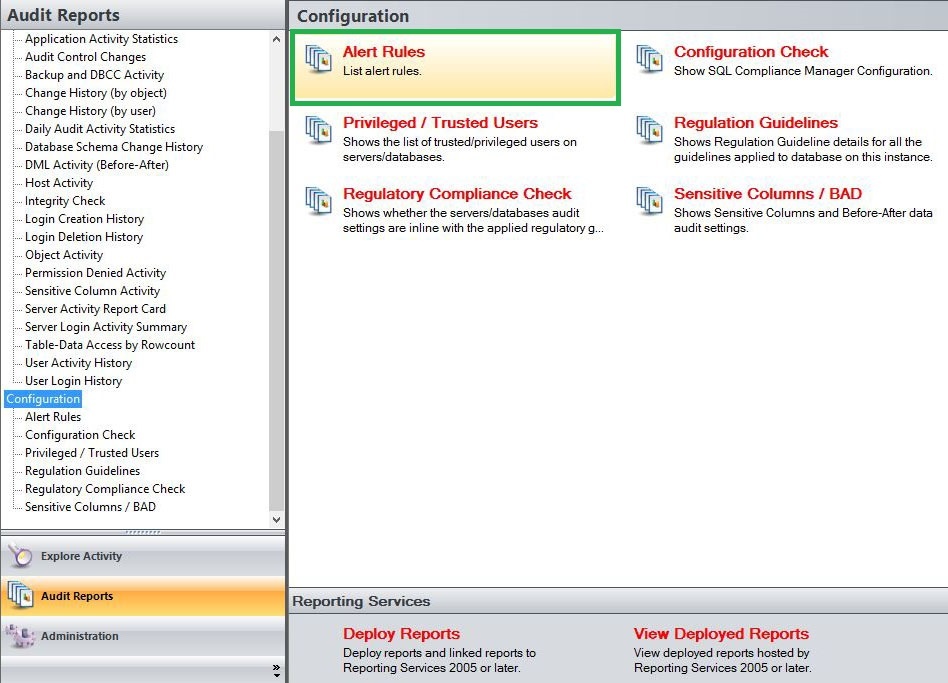
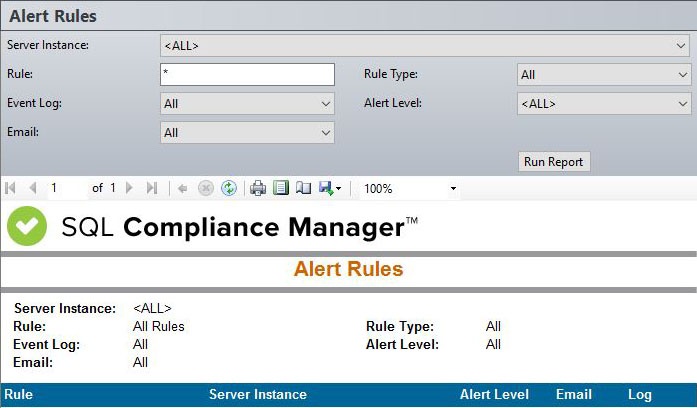
Alert Rules report shows a lists of all the existing alert rules in your environment, you can filter the alerts by the rule name, by the alert level or by selecting the rule type. Use this report to monitor all types of alert rules in your environment.
A filter can include a list of wildcards, separated by commas, where a wildcard is a string, which may contain asterisks. The following parameters are specific to the selected report and enable you to filter the data to include in the report.
Available actions
Server Instance
Allows you to select a registered instance on which you want to report. Select ALL to report on all instances.
Rule
Allows you to type the name of one or more rules on which you want to report.
Rule Type
Allows you to select the rule type on which you want to report. Select between the following rule types; All, Event Rules, Status Rules or Data Rules.
Event Log
Choose to filter alert rules based on alerts which log events or do not log events. Select ALL to report on all alert rules.
Alert Level
Choose to filter alerts by their different levels; Severe, High, Medium, or Low.
Allows you to select whether display Alert Rules with an email associated to the rule or display Alert Rules with no email associated to it. Select All to display all Alert Rules.
Run Report
Click this button to Run the report.
Default columns
Rule
The Rule column displays the name of the alert rule.
Server Instance
The Server Instance column displays the name of the Instance Server where the event was captured.
Alert Level
The Alert Level column displays the level the alert is configured to.
The Email column specifies whether the alert rule has an email address associated to it, in order to receive the alerts.
Log
The Log column specifies whether the alert rule is configured to log events.
...