Page History
The single instance dashboard view includes an overview Overview and Sessions section for the selected monitored SQL server and specific category views. SQL Diagnostic Manager users are able to obtain details on sessions, queries, resources, and databases. Click image to view full size.
| Info | ||
|---|---|---|
| ||
When the monitored instance it is registered in SQL Workload Analysis, the Launch SWA icon displays on the right side of the History Range Control. Click the Launch SWA icon to be redirected to SQL Workload Analysis. |

In the single instance dashboardview, you can find the following sections:
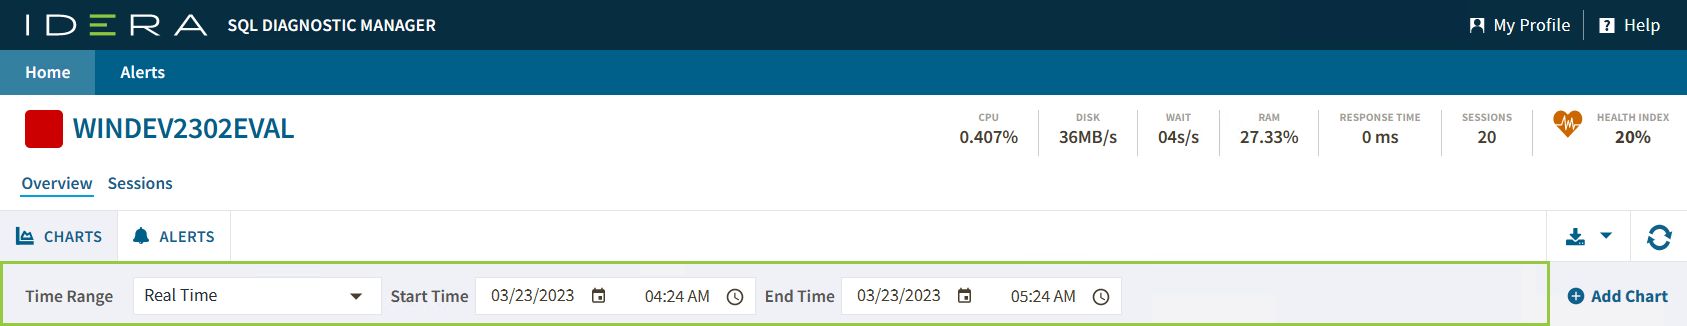
- History Range Control
- Alert and Health Status Summary
- Prescriptive Analysis Summary
- Server properties
- Prescriptive Analysis
- Alert Timeline
- Alert Categories
- Charts
- Charts
- Alerts
Anchor HR HR
History Range Control
| HR | |
| HR |
SQL Diagnostic Manager IDERA Web Console also includes a new History Range Control, located at the top of the Web Console and in the option History Browser in the Desktop Console, both can be modified and be designated a specific start time and date as well as a current snapshot.. You can modify it by changing the start and end time and date.
Anchor AHS AHS
| AHS | |
| AHS |
...
Status Summary
In this section, you can find the health index, the alert status, and the user sessions from SQL Diagnostic Manager. Also, includes shortcuts to filter data through Sessions, Queries, Resources, and Databasesspecific metrics of the selected instance. Such as CPU usage, SQL Disk I/O, SQL Memory usage, Average Response Time, Sessions, and Health Index.
Anchor
...
charts
| charts |
...
charts
| charts |
...
Charts
The prescriptive summary shows the previous analysis information and the resulting recommendations summary. You can click any category under Recommendation Summary to be redirected to the Analyze tab in the desktop console
...
single instance dashboard includes the option Add Chart. Click it and the Manage Charts window pop up, allowing you to choose the graphs to be displayed in the overview single instance view.

The Manage Charts window allows you to choose as many charts as you want from the following options:
CPU Usage
The CPU Usage chart displays the percentage of the processing power on the computer that hosts the instance over a period of time.
CPU Processor Queue Lenght
The CPU Processor Queue Length graph displays the current value of the processor queue length metric.
CPU Call Rates
The CPU Call Rates chart displays a details view of the resource-intensive activities.
Cache Areas
The Cache Usage chart displays the usage in megabytes of each type of cache in use on your instance.
Cache Hit Ratio
The Cache Hit Ratios gauge displays the hit rates of the Buffer and Procedure cache in the monitored SQL Server instance.
Custom Counters
The Custom Counters panel displays the statistics of a selected custom counter on a monitored SQL Server instance.
Cache Hit Ratio
The Cache Hit Ratios gauge displays the hit rates of the Buffer and Procedure cache in this SQL Server instance.
Databases
The Databases panel
...
In this section view the most important characteristics of your monitored SQL Server instance.
Instance Name
Displays the name of the monitored SQL Server instance or its friendly name assigned in the desktop console.
| Tip |
|---|
Assign a friendly name to your instance that is meaningful to you and easy to identify. |
SQL Version
Indicates the current SQL Server version including service pack and build information on this SQL Server instance.
SQL Edition
Indicates the current SQL Server edition, including Enterprise, Business Intelligence, or Standard, installed on this SQL Server instance.
Running since
Indicates the timestamp associated with the most recent restart of this SQL Server instance.
Clustered
Indicates whether this SQL Server instance is part of a cluster. If it is part of a cluster, SQL Diagnostic Manager displays the name of the active node.
Processors
Indicates the total number of processors associated with this SQL Server instance and how many of these processors are currently in use.
Host
Indicates the name of the server hosting this SQL Server instance.
Host Memory (GB)
Indicates the total amount of memory on the server hosting this SQL Server instance.
Host OS
Indicates the current operating system on the server hosting this SQL Server instance.
Data Size
Displays the data size of the server.
Log Size
Displays the log size of the server.
...
The Prescriptive Analysis panel shows a summary of the performed Analyses, this panel shows the Date, the Duration, the Task Type, the number of recommendations, the Priority, and you can click the Show Recommendations to review the list of recommendations of each Analysis.
...
This graph shows a summary of the alert categories, CPU, Memory, I/O, Databases, Logs, Queries, Services, Sessions, Virtualization, Operational and Custom. This graph is color-coded depending on the status of the alerts inside each category.
...
This alert timeline view allows you to easily identify the highest alert for your monitored SQL Server instance and the highest alert for a specific category.
Configure the Alert Category graph, following these steps:
- Click Edit, located next to the Alert Timeline graph.
- Check or uncheck the checkboxes located under the Visible column.
- Or, reorganize the Order column with the listed numbers preferred.
- Click Save.
...
The single instance dashboard includes the option MANAGE GRAPHS. This option allows you to choose the following graphs to be displayed in the overview single instance view:
Cache
The Cache chart tracks the database and procedure processes using a buffer pool of memory on your monitored SQL Server instance.
CPU
The CPU chart tracks the performance of the processor used by your monitored SQL Server.
Custom Counters
The Custom Counters chart displays the statistics for a selected custom counter on a monitored SQL Server instance.
Databases
...
tracks the performance of the databases on your monitored SQL Server.
Disk Latency
...
The Disk Latency chart
...
plots the average time (in milliseconds) required to complete disk reads and writes, tracking the disk IO speed over time.
Cache Page Life Expectancy
The Page Life Expectancy chart provides the time in seconds that a page remains in the cache or buffer pool.
File Activity
...
The File Activity
...
panel displays the top five database files with the highest relative activity since the last refresh.
Lock Waits
...
The Lock Waits
...
panel tracks the total number waits caused when a task is waiting to acquire a lock on your monitored SQL Server.
Disk SQL Server Physical I/O
The SQL Server Physical I/O chart breaks down the SQL Server throughput into its key component pieces, giving you a detailed view of how well the SQL Server is processing your data requests and updates.
Disk Throughput
The Disk Throughput chart plots the number of disk reads and writes over time.
Memory
...
The Memory chart tracks the usage and availability of memory on your monitored SQL Server computer.
Network
...
SQL Server Usage
The SQL Server Usage chart compares the amount of memory allocated and used by SQL Server to the total memory consumed by a computer.
Memory Paging
The SQL Server Paging chart plots the number of swapped pages per second, over time, as calculated by the memory paging metric.
Memory Usage
The Memory Usage chart compares the amount of memory allocated and used by SQL Server to the total memory consumed by this virtual machine.
Network Response Time
The Response Time gauge displays the time (in milliseconds) SQL diagnostic manager currently needs to send a simple SQL command to the SQL Server instance, have it processed, and receive the returned result set.
Network Throughput
The Throughput chart plots how many packets this SQL Server sends and receives over time.
Server Waits
...
The Server Waits
...
panel tracks the total number and time spent on waits affecting your monitored SQL Server.
Sessions
...
Session Activity and Blocking
The Activity and Blocking chart displays the total number of active sessions on your monitored SQL Server instance and any blocking or deadlocks that may occur between sessions.
tempDB
...
Session Client Computers
The Client Computers graph displays the total number of unique client computers connected to the SQL Server instance.
Virtualization
The Virtualization chart tracks the performance of your virtual machine or host, depending on the selection in the panel.
...
The single instance dashboard contains the Overview, Sessions, Queries, Query Waits, Resources, Databases, and Alerts tabs where you can see metrics and information on these category views.
From these tabs you can:
...
Access the single instance dashboard
...
Tempdb Contention
The Tempdb Contention chart provides the latch wait time for the allocation pages of your tempdb.
Tempdb Space Used
The Tempdb Space Used chart provides different views of how your database is used over time based on the object type.
Tempdb Version Store Cleanup Rate
The Version Store Cleanup Rate gauge displays the current version store cleanup rate and the version generation rate of the data rows necessary to support snapshot isolation.
Virtualization CPU Ready Wait Time
The CPU Ready Wait Time gauge displays the current gauge value of the vCPU Ready Time metric available on the Server Details view.
Virtualization Disk Usage
The Virtual Disk Usage chart displays the amount of data read from and written to disk for the VM or host server during the sample interval.
Virtualization Memory Usage
The Virtual Memory Usage chart displays the amount of memory allocated and used by SQL Server to the total memory consumed on this VM or host server.